


Latest data from APRA shows the de-risking of mortgage lending continues
The data for the December 2024 quarter showed that mortgage arrears remained low and for almost 7 out of every 10 new mortgages over the quarter borrowers had a 20% deposit.

The APRA property exposures data which is published each quarter always has some valuable insight into the lending environment.
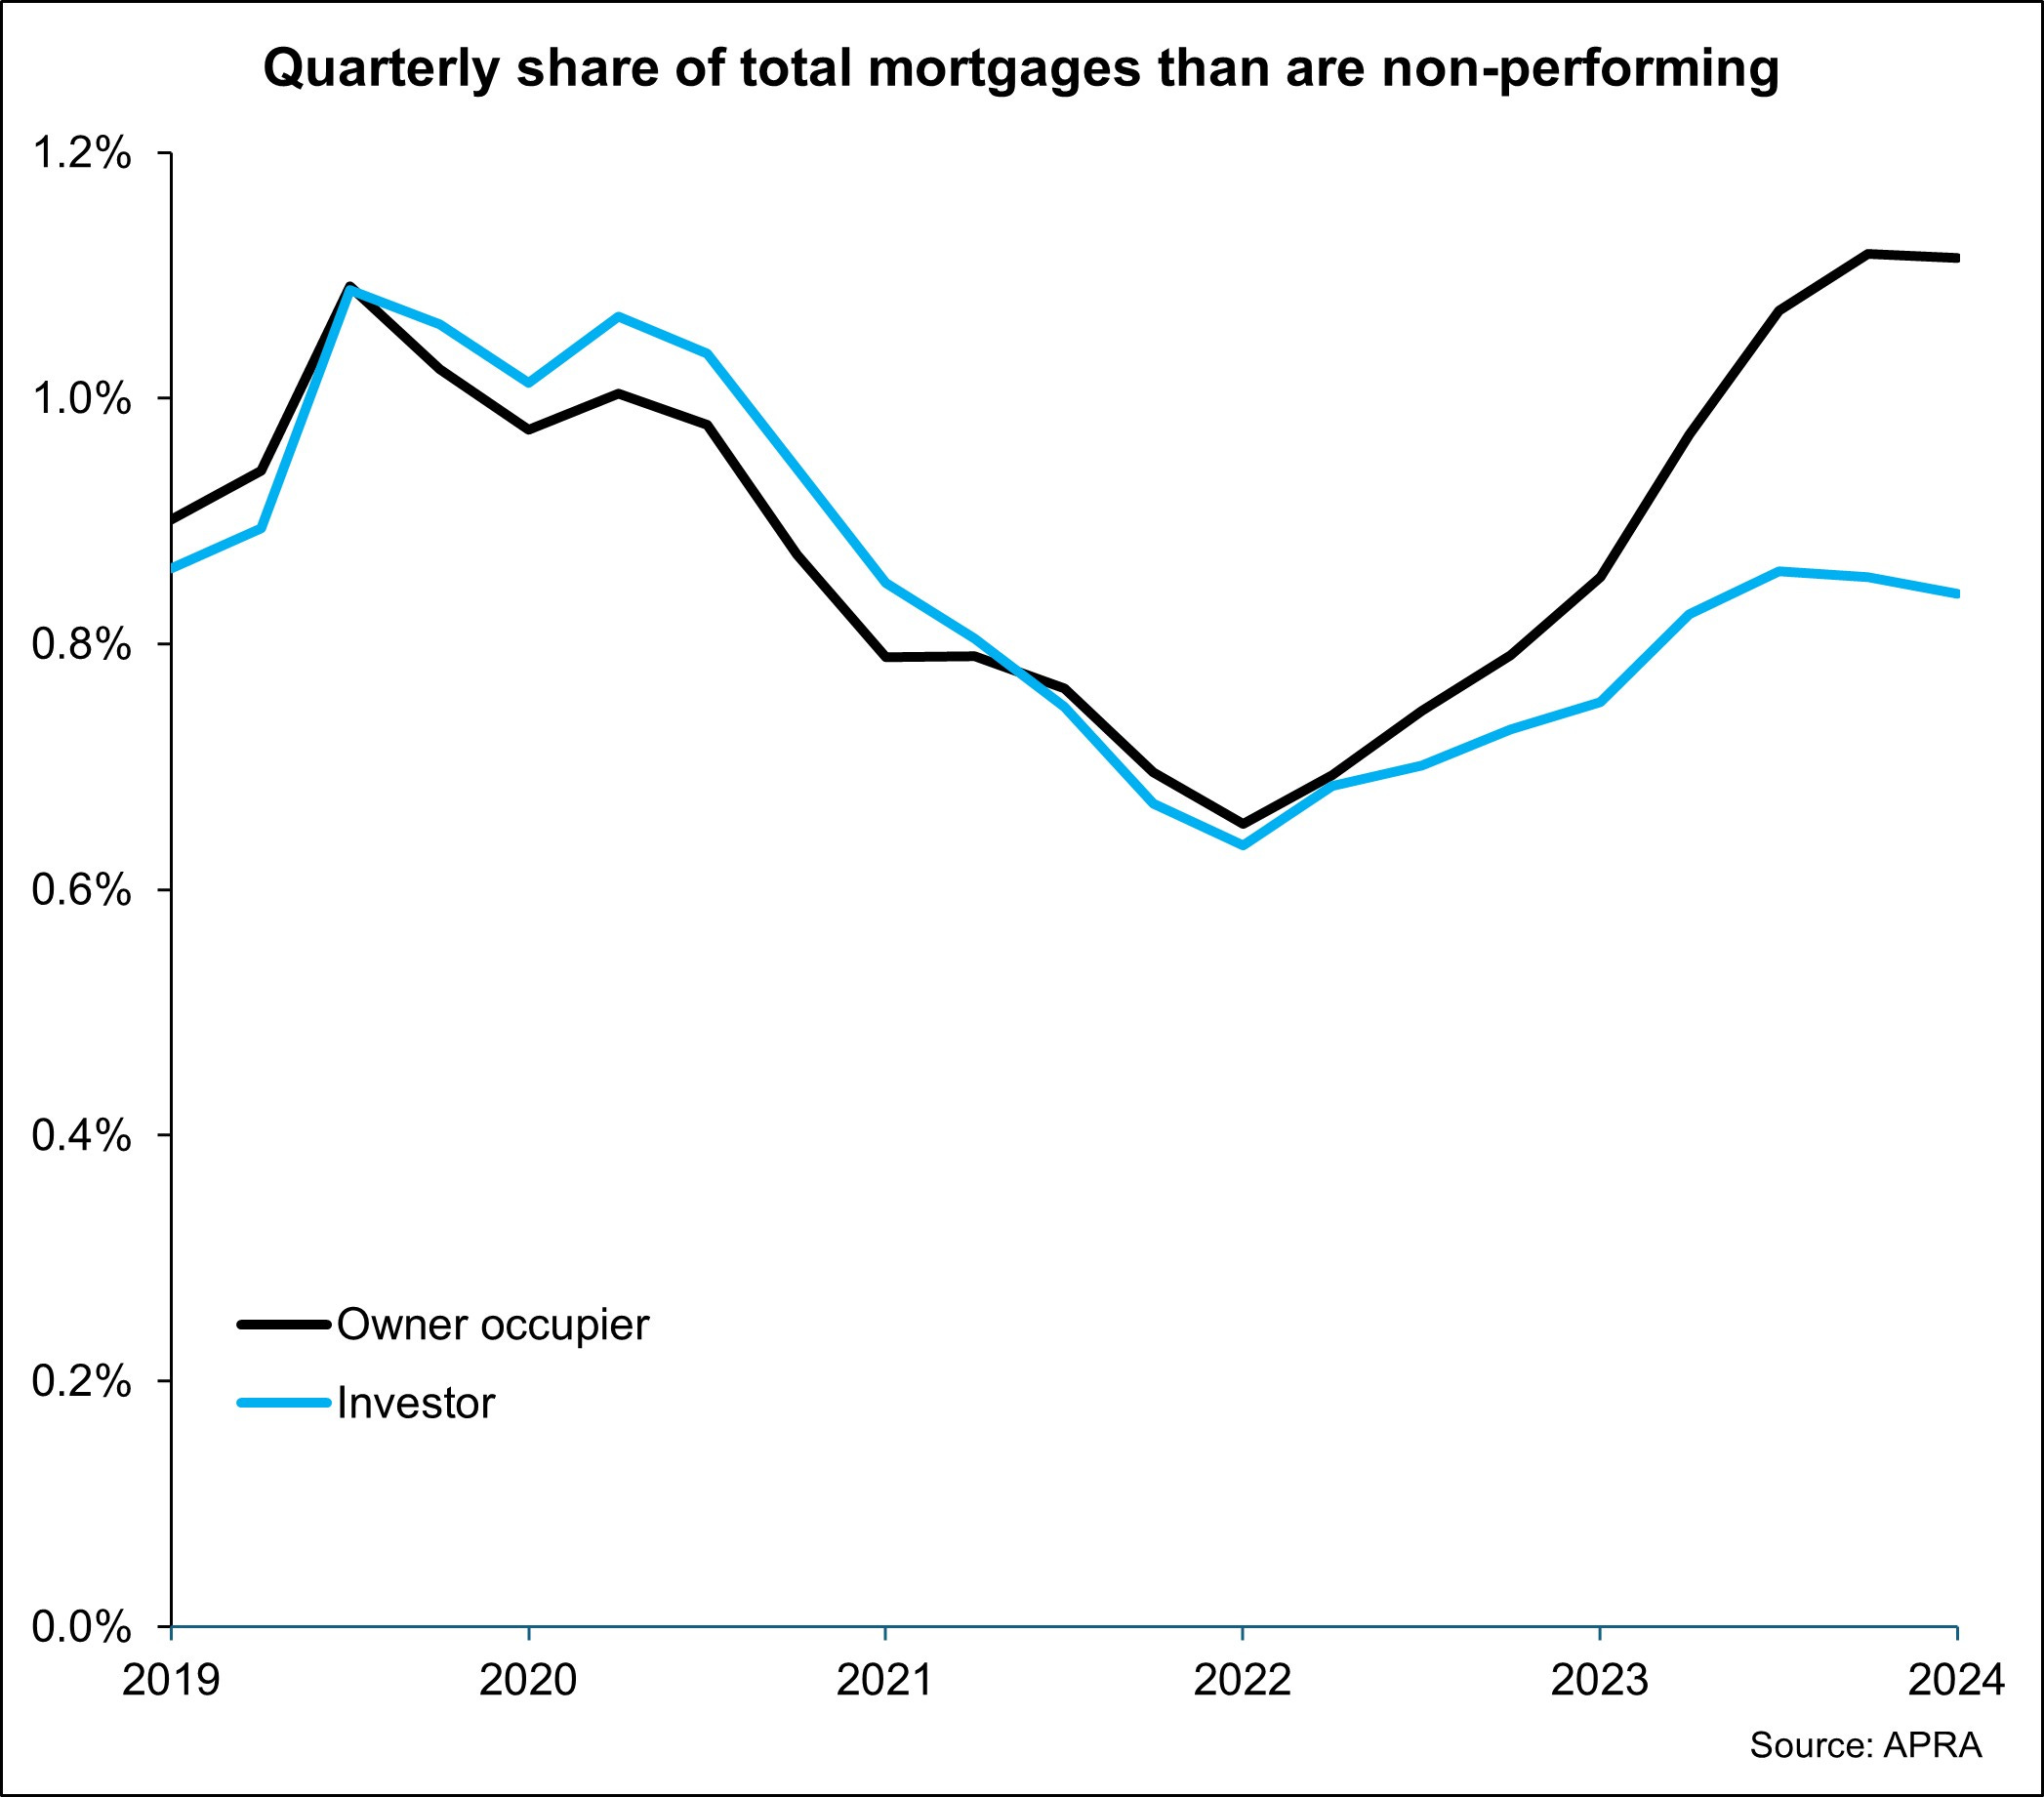
Firstly the share of non-performing loans was steady over the quarter for owner-occupier loans while it was lower for investor loans. When you consider how quickly interest rates have risen over recent years, the volume of non-performing loans has remained low.
It’s also interesting to note how the share of investor loans which are non-performing is far fewer than those for owner-occupiers. This likely speaks to the fact that owner-occupiers are much more attached to their properties and will try to hold the asset through hardship while investors may be more pragmatic about dispensing of properties that they don’t live in.
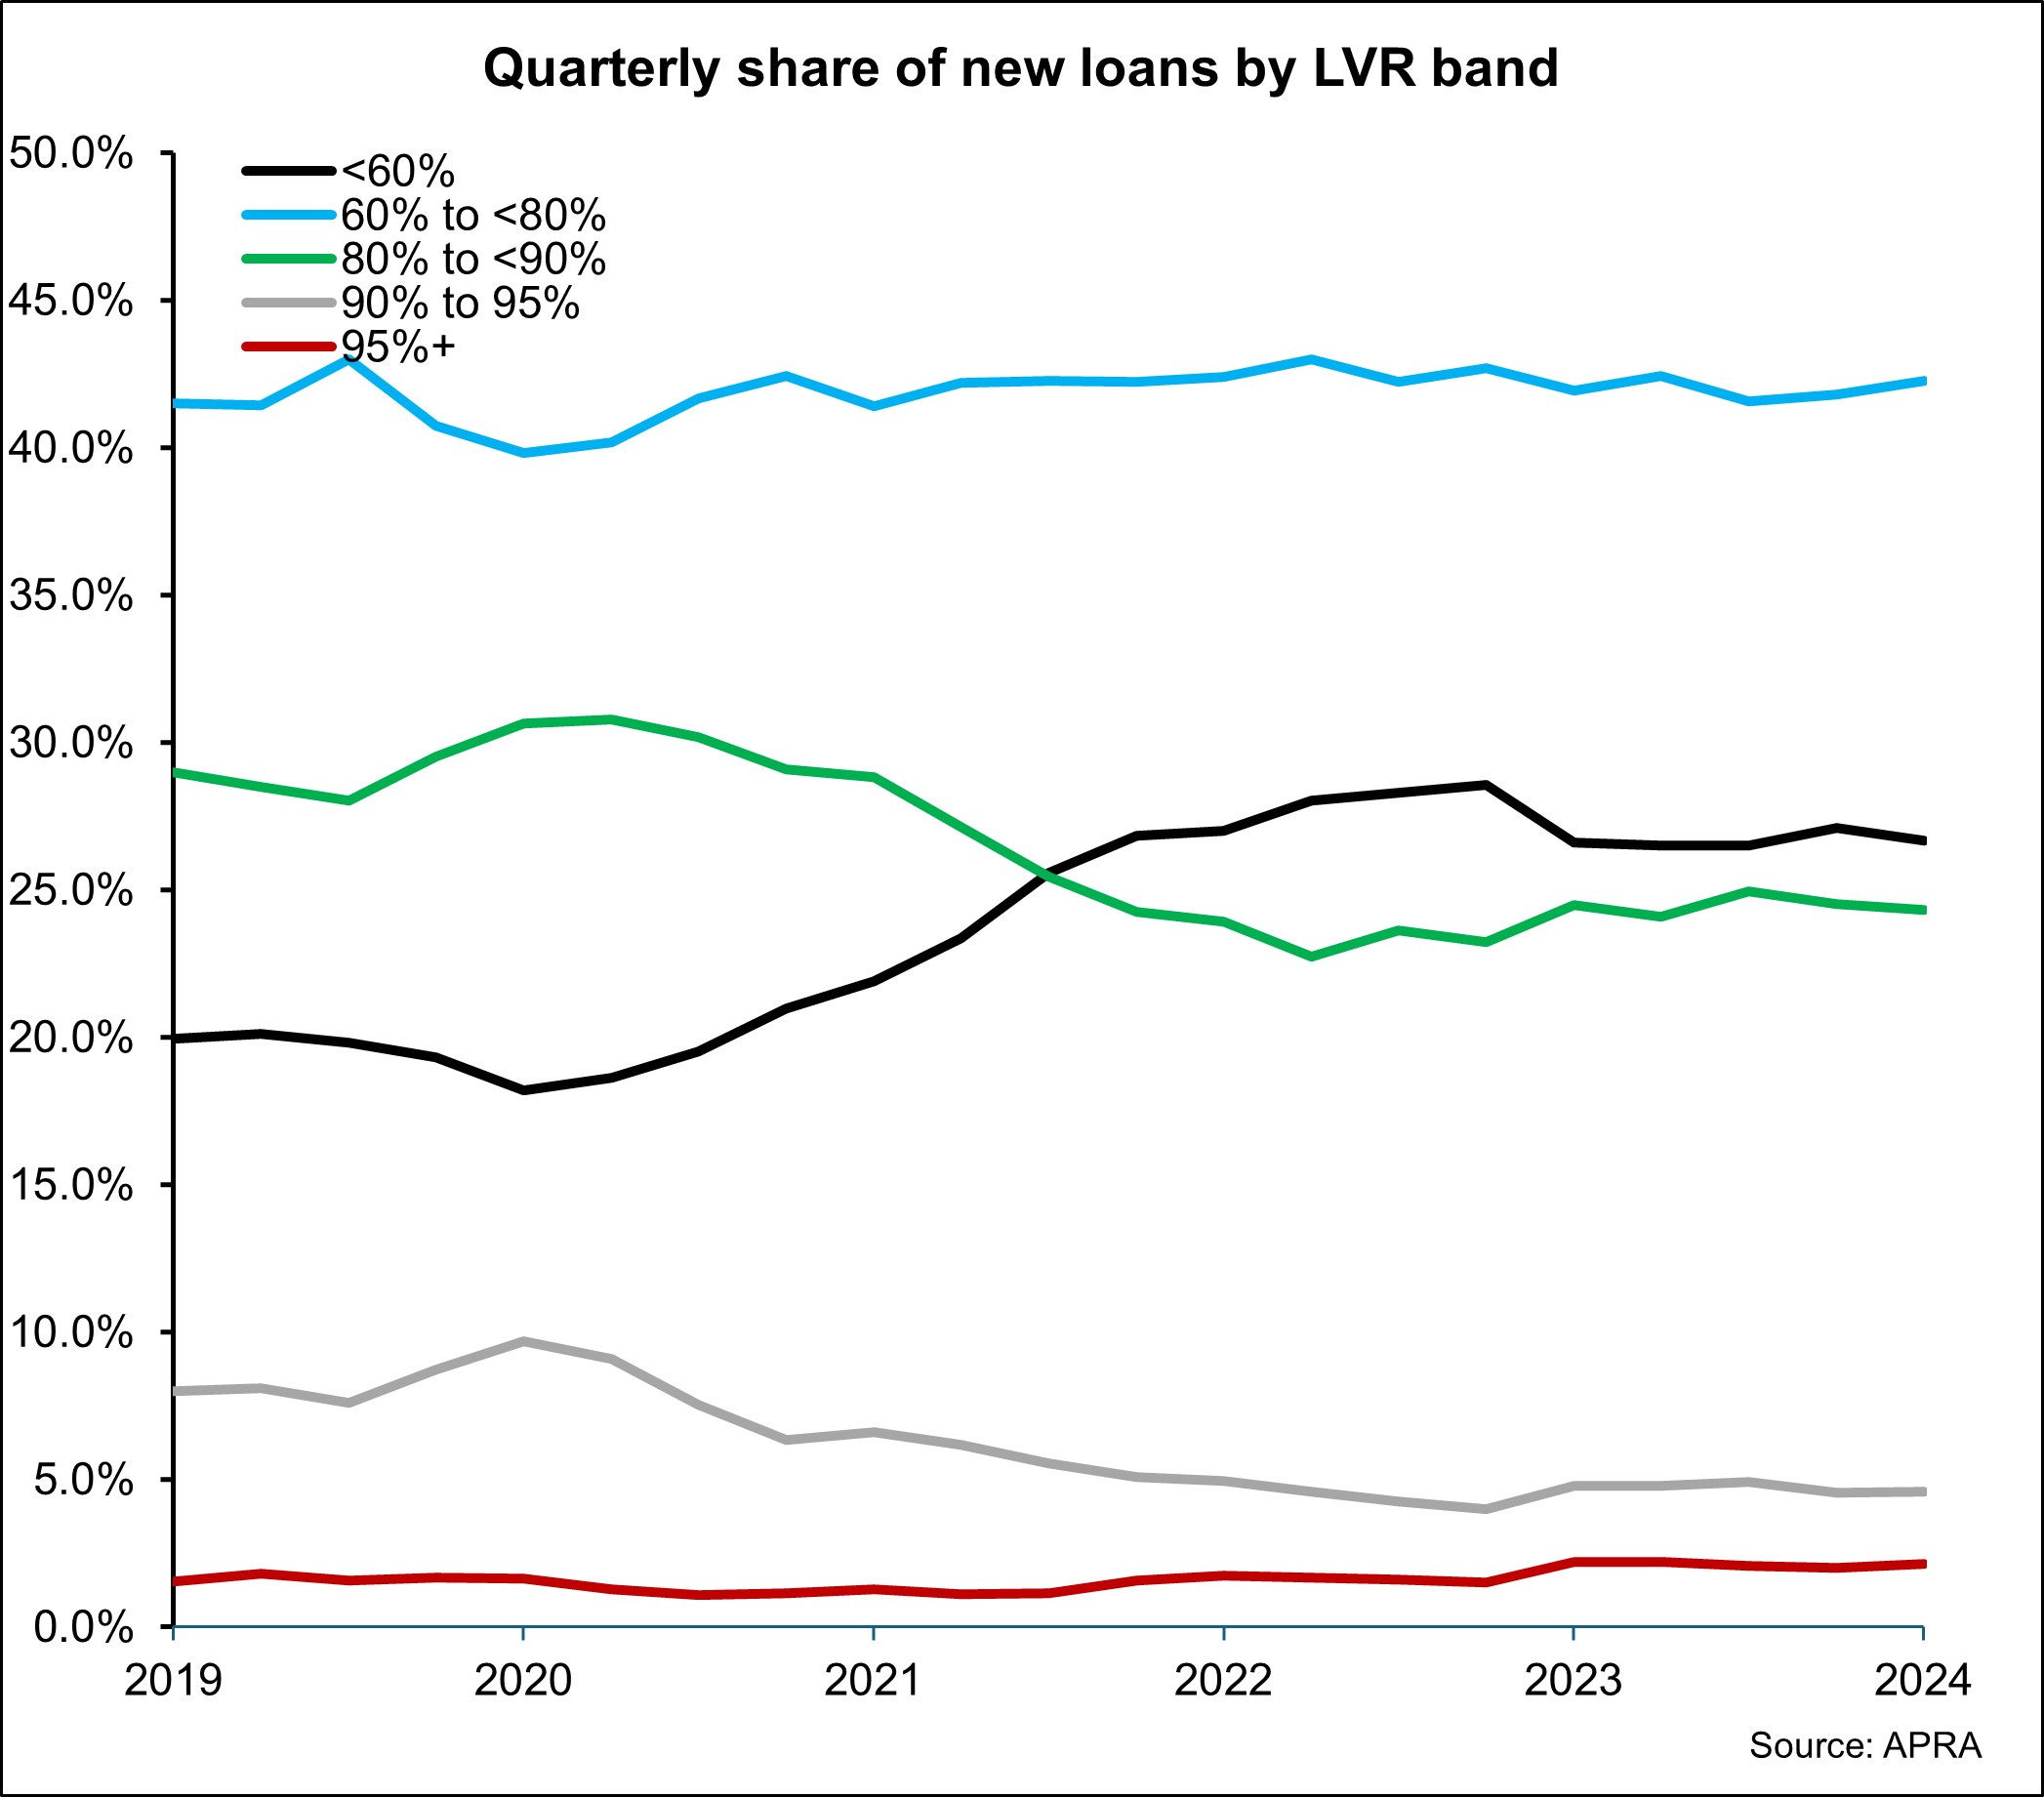
The second chart highlights the quarterly share of new lending by their loan to valuation ratio (LVR) split into ranges. New lending with an LVR of 60% or less and 60% to 80% accounted for the largest share of new lending. This means most new borrowers are providing at least 20% equity and as such avoiding lenders mortgage insurance (LMI).
69% of new mortgages written over the quarter had an LVR of less than 80% which was the highest share since the Sep 23 quarter.
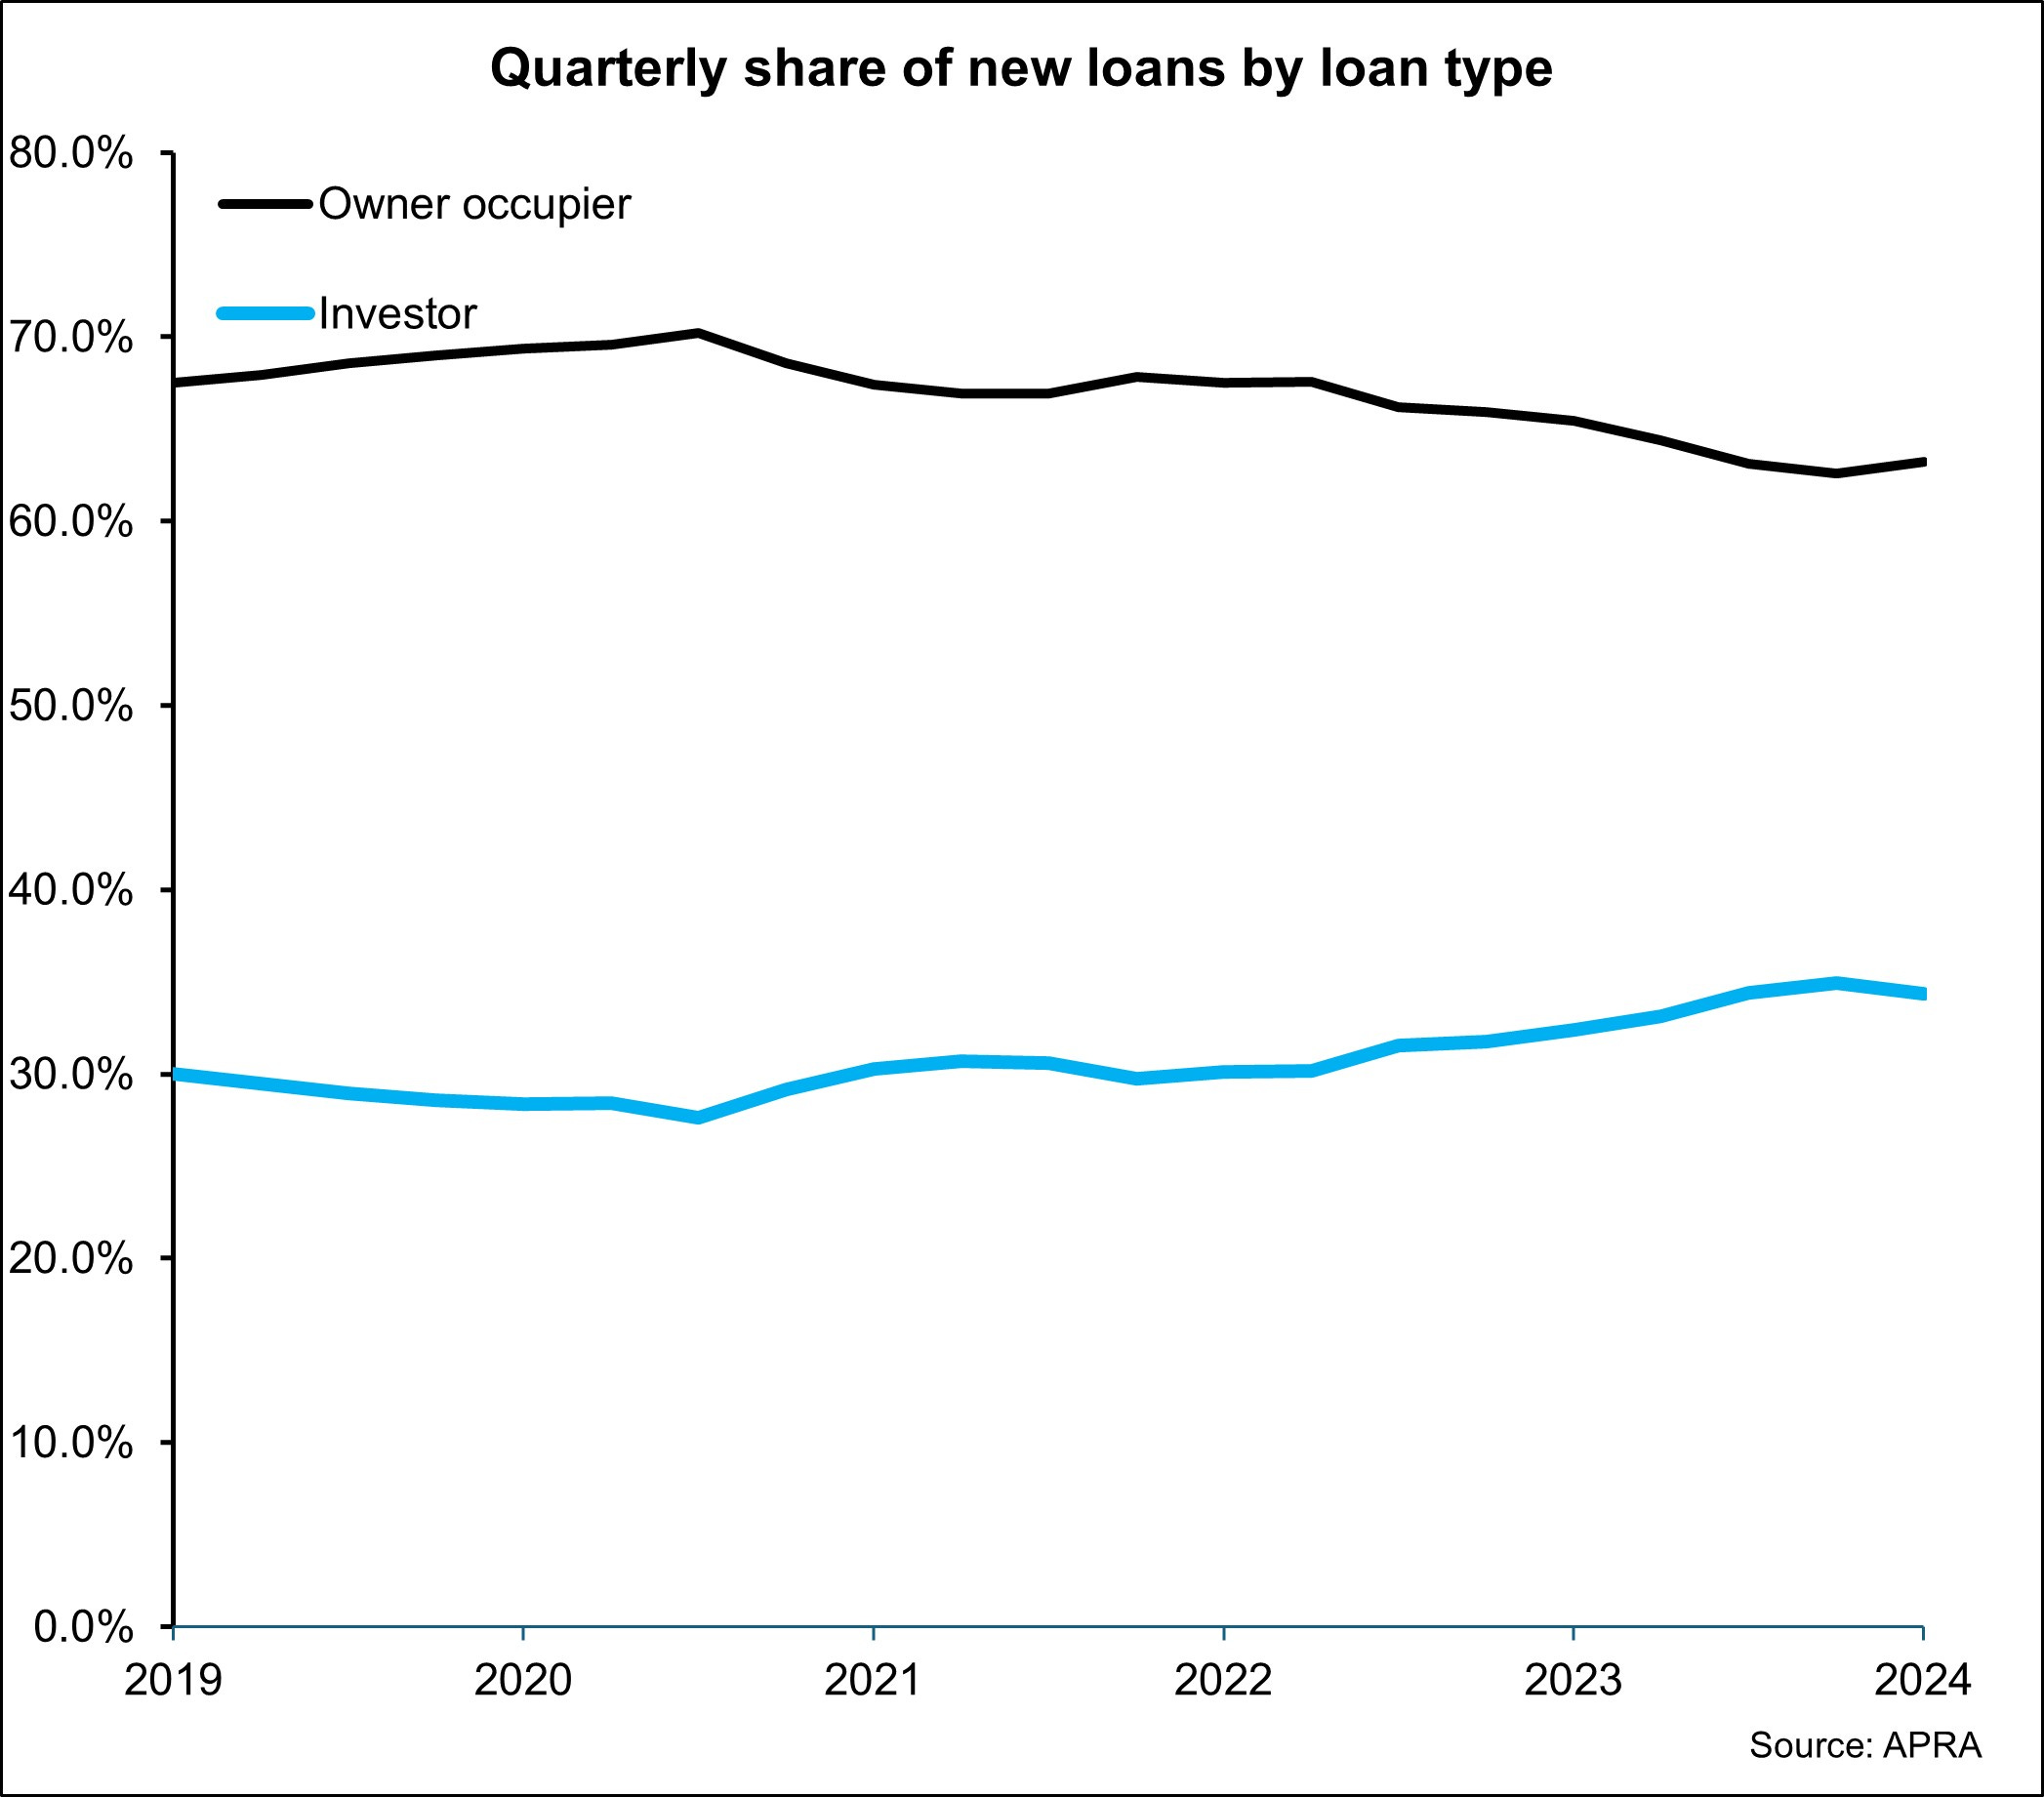
The value of lending to owner-occupiers increased by 10.1% over the quarter to be 13.9% higher over the 12 months to Dec 24. Meanwhile lending to investors was 7.1% higher over the quarter and 25.1% higher over the year, the largest annual rise since Dec 21. Despite the stronger lift in lending to investors, the share of lending to owner-occupiers remains substantially greater.
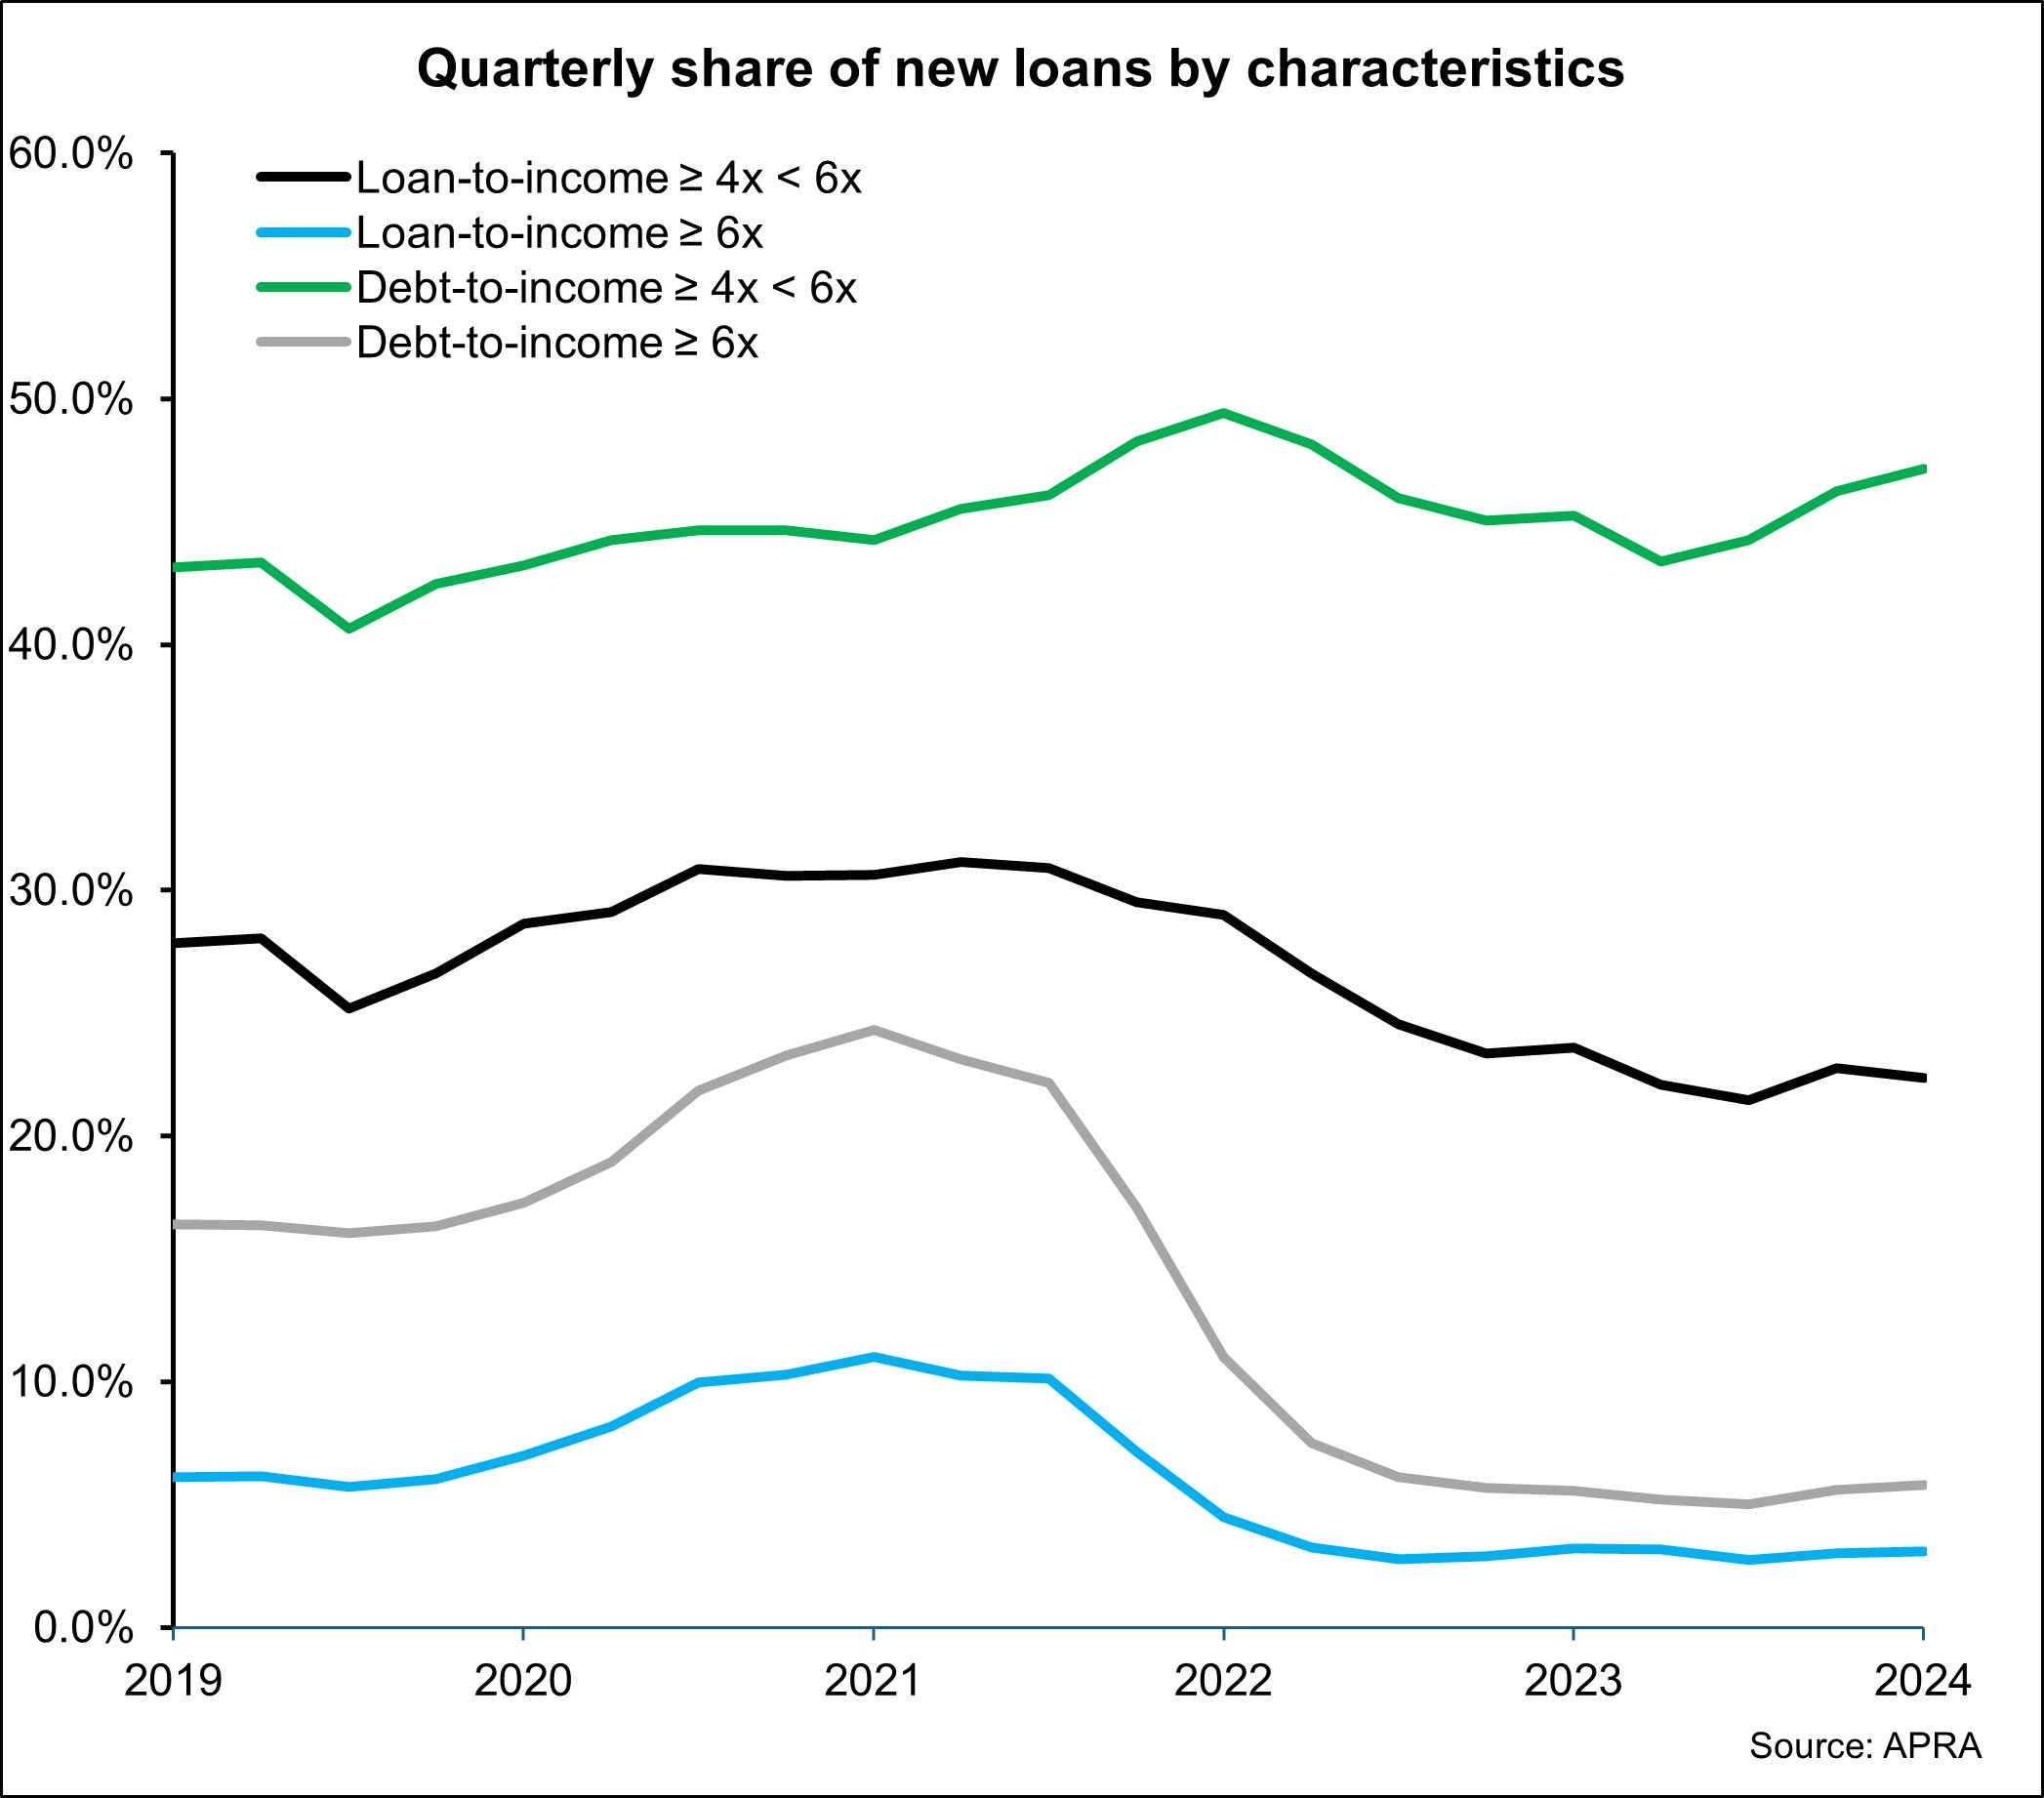
The above chart highlights the conservatism in lending currently with only 3.1% of new loans over the quarter having a loan to income ratio of more than 6 times and 5.8% of new loans having a debt to income ratio of more than 6 times. While these shares were marginally higher over the quarter they are significantly lower than a few years back.
Overall these data highlight the nature of lending right now which is quite conservative with the release reporting the weighted average serviceability assessment rate over the quarter was 9.3% compared to an average variable rate of 6.3%, highlighting the 3% serviceability buffer.
In most instances, new lending is undertaken with 20% or more equity from the borrower and there are few instances where loan to income or debt to income ratios are in excess of 6 times. The share of non-performing loans has risen as interest rates have increased but remains low with around one non-performing loan in 100 loans and fewer than that for investors.
With interest rates falling in Feb 25 we’re likely to see a pick-up in demand for mortgages over the coming quarters and it will be interesting to monitor these metrics to see just how much loosening there is.