


How can people keep bidding prices higher? It's all about the equity
Some people seem perplexed as to how people can keep paying more and more for homes but with how much equity most borrowers have, it is not difficult to push prices higher.

Over recent years we’ve seen interest rates reduced to historic lows followed by one of the largest and fastest increases in interest rates on record, yet through it all property prices have continued to rise perplexing some. The truth is though, that the historic growth in property prices over recent decades has bequeathed most property owners significant equity in their properties.
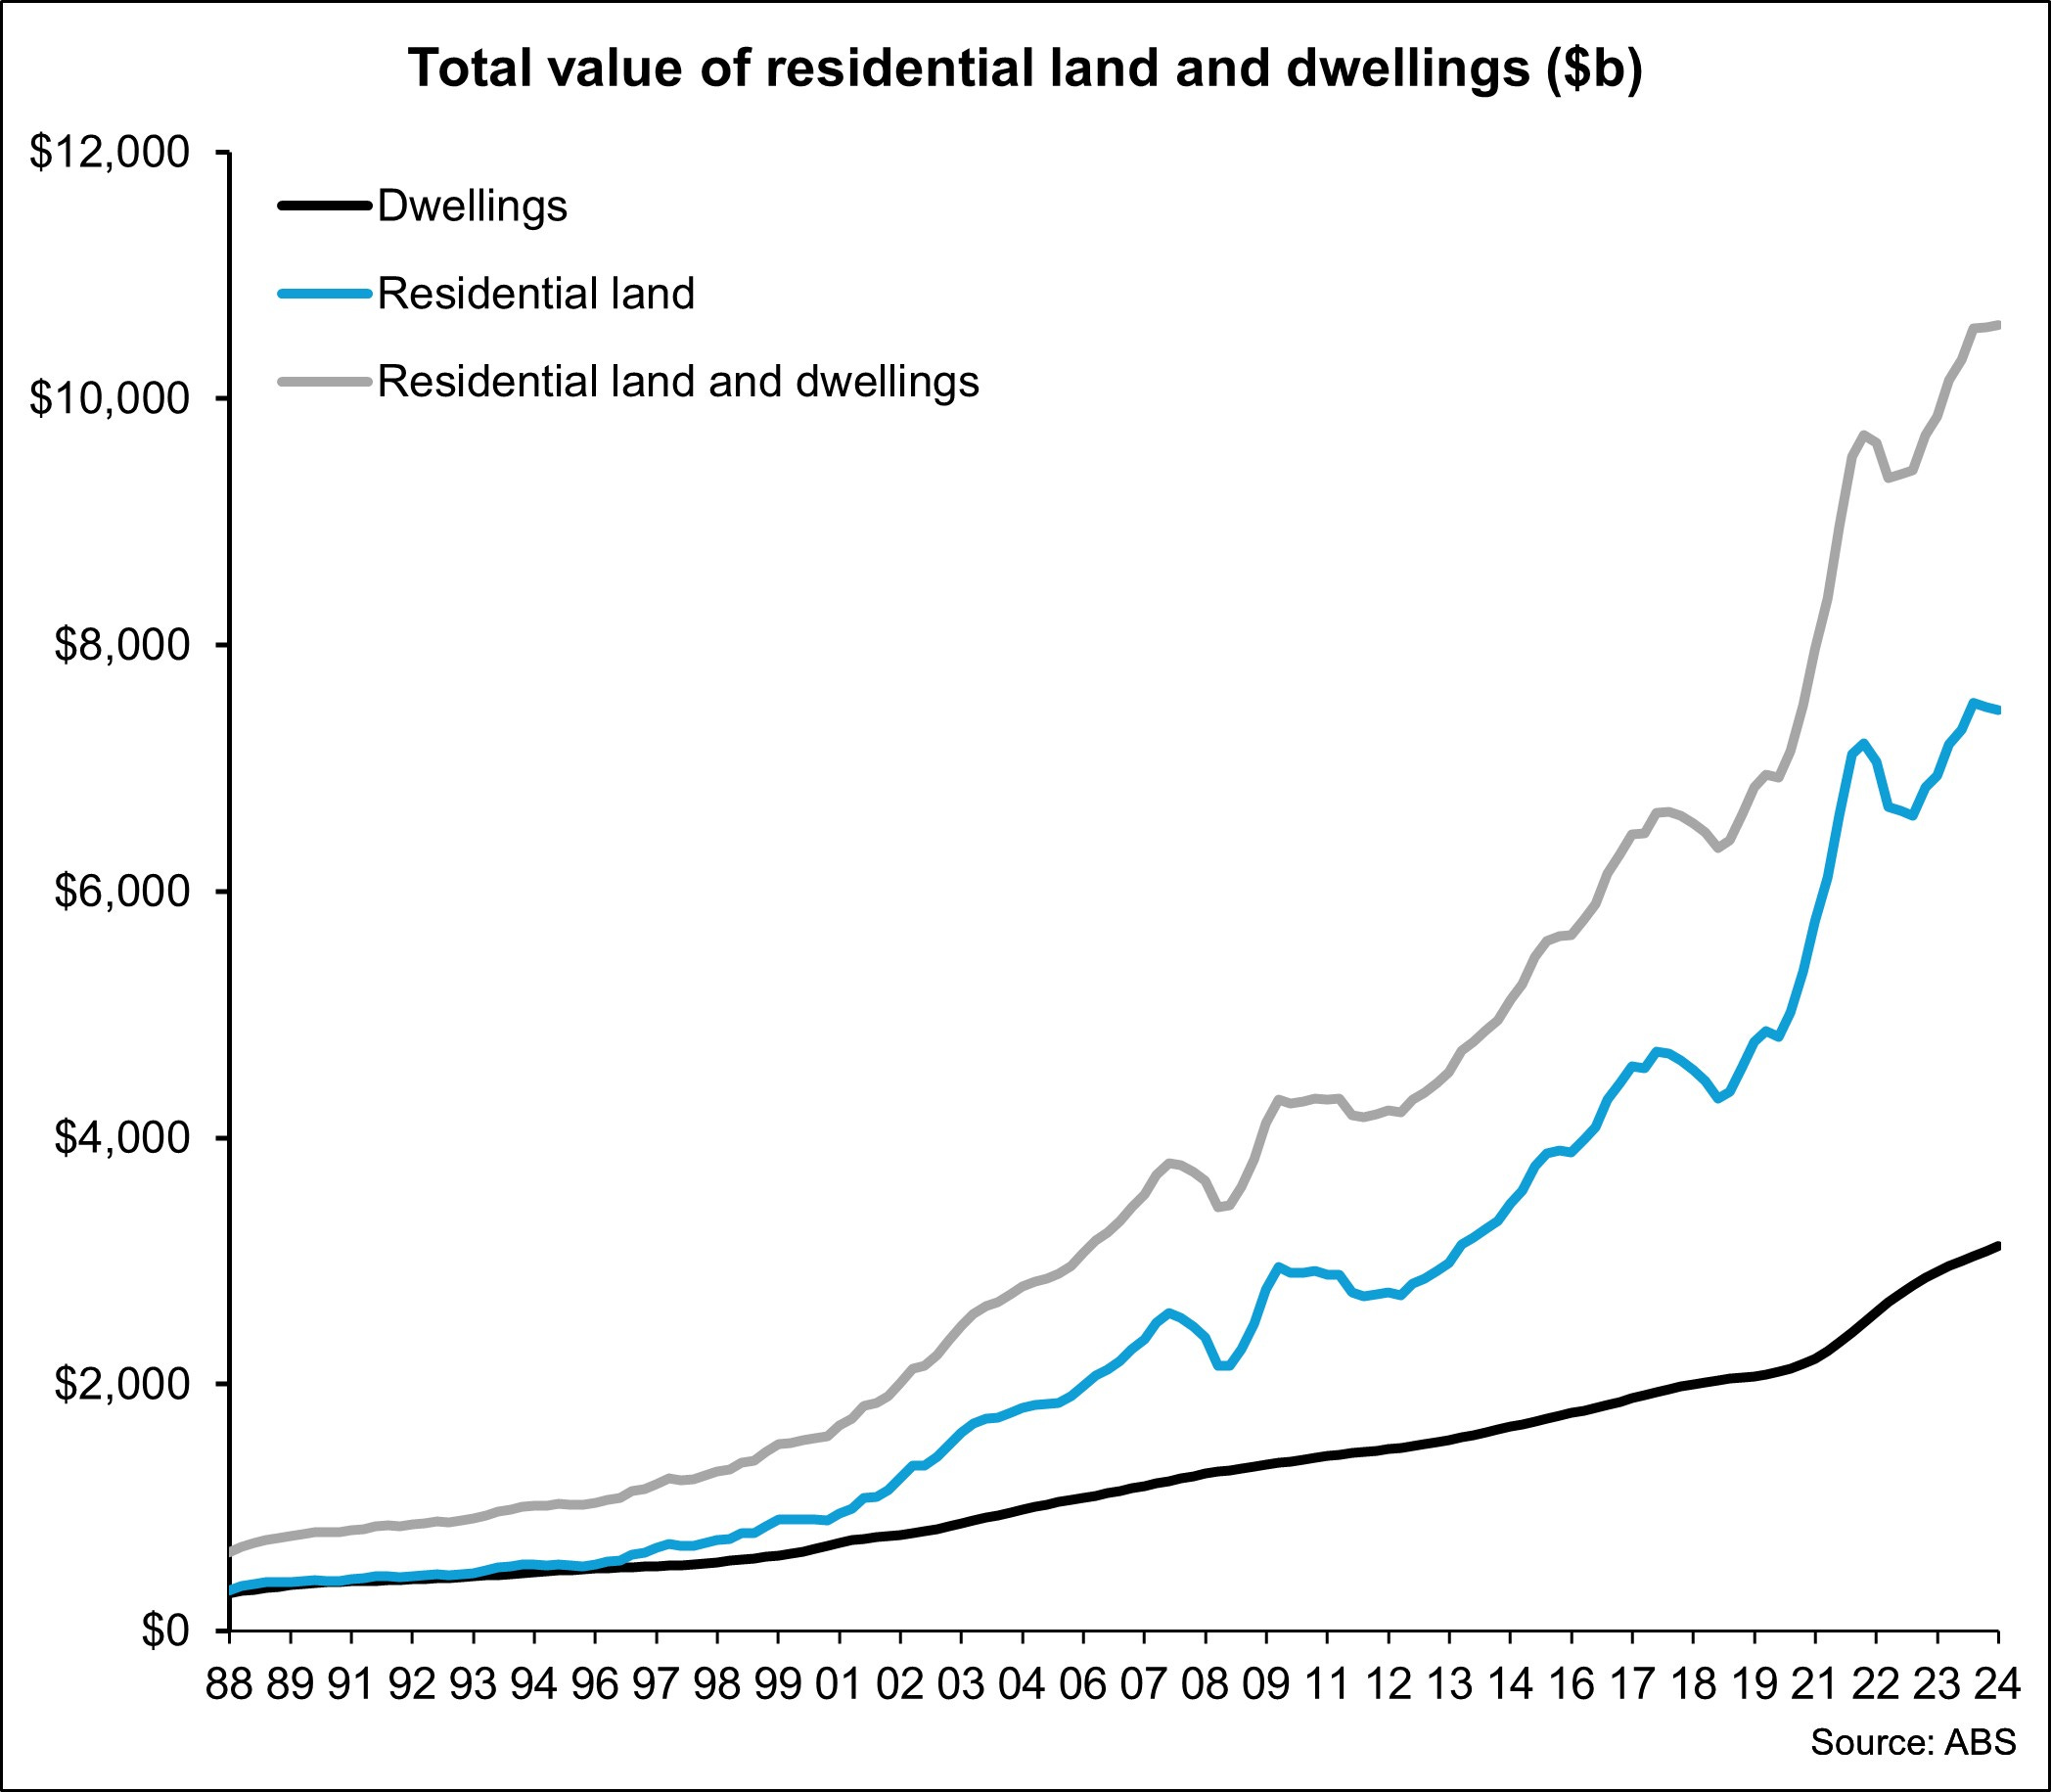
In Dec 24, the total value of residential land and dwellings owned by households had reached $10.598 trillion which was +4.4% over the year and accounted for 52.5% of total household assets. Dwellings accounted for $3.124 trillion or 15.5% of total household assets while residential land accounted for $7.475 trillion or 37% of total household assets.
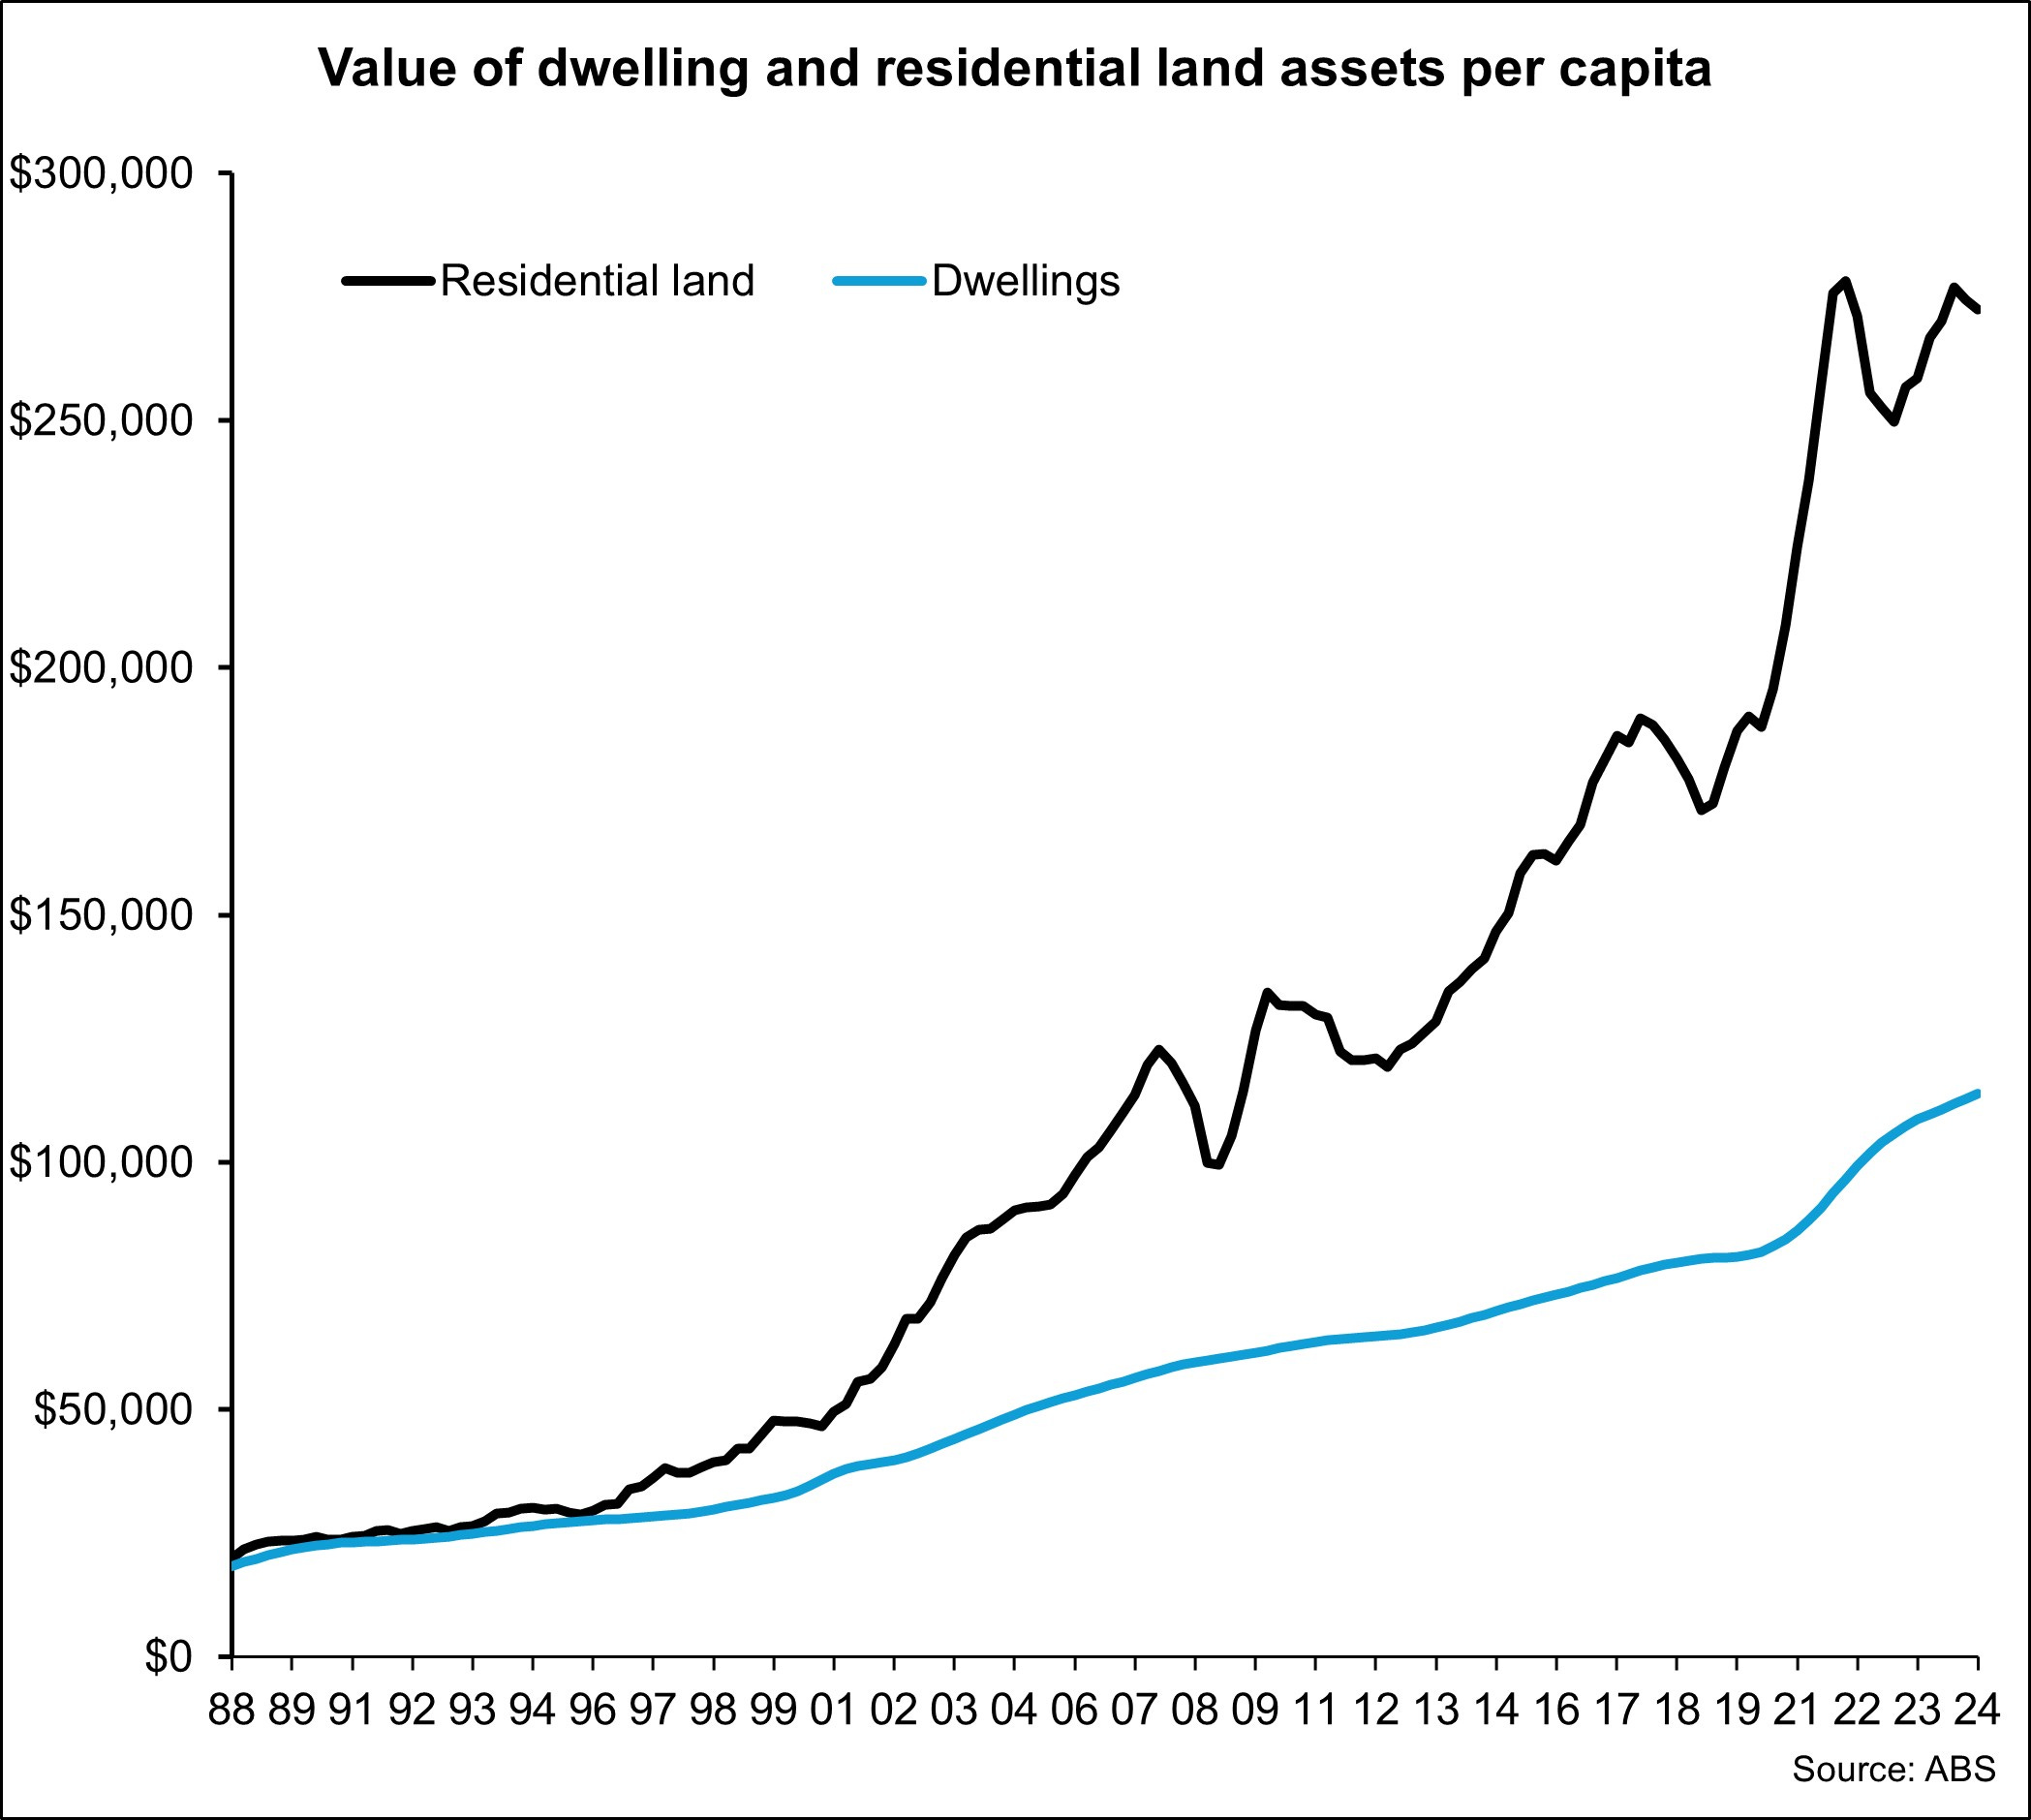
Based on these figures and the latest population estimates from National Accounts, at the end of 2024, every person in Australia had $272,543 in residential land assets and $113,891 in dwelling assets.
It’s noticeable from each of the previous charts how residential land values and dwelling values were fairly closely matched right up until the late 1990s. As demand for housing has lifted thereafter and we’ve made land more scarce through planning controls and increased costs on its delivery we have seen the value of residential land significantly detach from dwelling values. Restricting the availability of land has been the primary driver of the increase in overall home values since the turn of the century.
This rapid escalation in land values has been the predominant driver in the increase in the cost of housing since the beginning of the 2000s. Between Dec 99 and Dec 24, the value of dwellings has risen by 414% while the value of residential land has increased by 726%. This surge in value which was driven primarily from land values has made people that own and hold housing assets wealthier. At the same time this escalation in housing costs has consistently made it more difficult for the next generation of buyers to enter into home ownership.
Despite this increase in housing assets (many see this as wealth) a lot of people speculate as to how long this can persist. But the ongoing increase in the value of housing assets is a key enabler of a household’s ability to trade-up in the housing market.
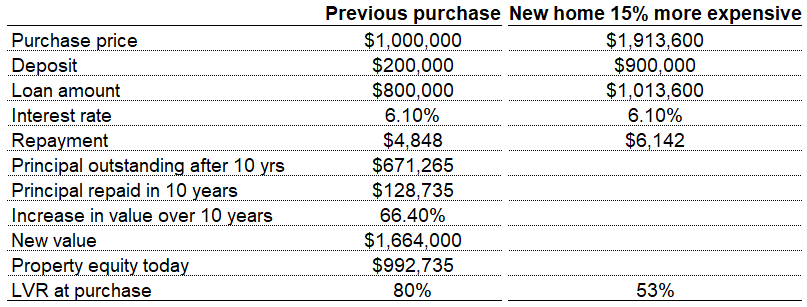
The above table shows a scenario for someone that purchased a home 10 years for $1 million with a 20% ($200,000) deposit. For simplicity of the calculation I have assumed they have been paying the current average principal and interest variable mortgage rate of 6.1% throughout the term which is 30 years and repayments are monthly of course interest rates have been lower most of the period so they have likely paid more off the principal than suggested here. I have also assumed the value of this home has increased by 66.4% over the past decade which is the 10 year increase in the Coatality Home Value Index.
Someone that purchased 10 years ago for $1 million in this scenario would now have a home worth $1,664,000. Just from the increase in value of the property their equity has increased from $200,000 to $864,000. With the amount of the principal they have repaid over a decade, their equity would have increased to a total of $992,735, an increase of $792,735 in 10 years.
Once they sell that property they will need to move somewhere else and the value of that home has also increased over the past decade. In this scenario I have assumed that they have purchased a property 15% more expensive than the one they have sold ($1,913,600) however, they have now purchased with a deposit of $900,000 and that leaves a loan amount of $1,013,600. Although this loan amount is much larger than the previous mortgage they took out, they are using significantly more of their own equity resulting in a loan to valuation ratio (LVR) for this mortgage of 53% compared to the previous 80%.
That equity can be used for reinvestment and although monthly mortgage repayments for the new loan are higher they aren’t significantly so. As interest rates come down, they will have the option to repay a lower mortgage rate.
It’s important to note that there are other costs such as stamp duty and there is the cost of upkeep on a property that wasn’t included in this scenario. Equally household costs may be different now to what they were a decade ago and no assumption has been made to any change in income or the overall increase in other assets.
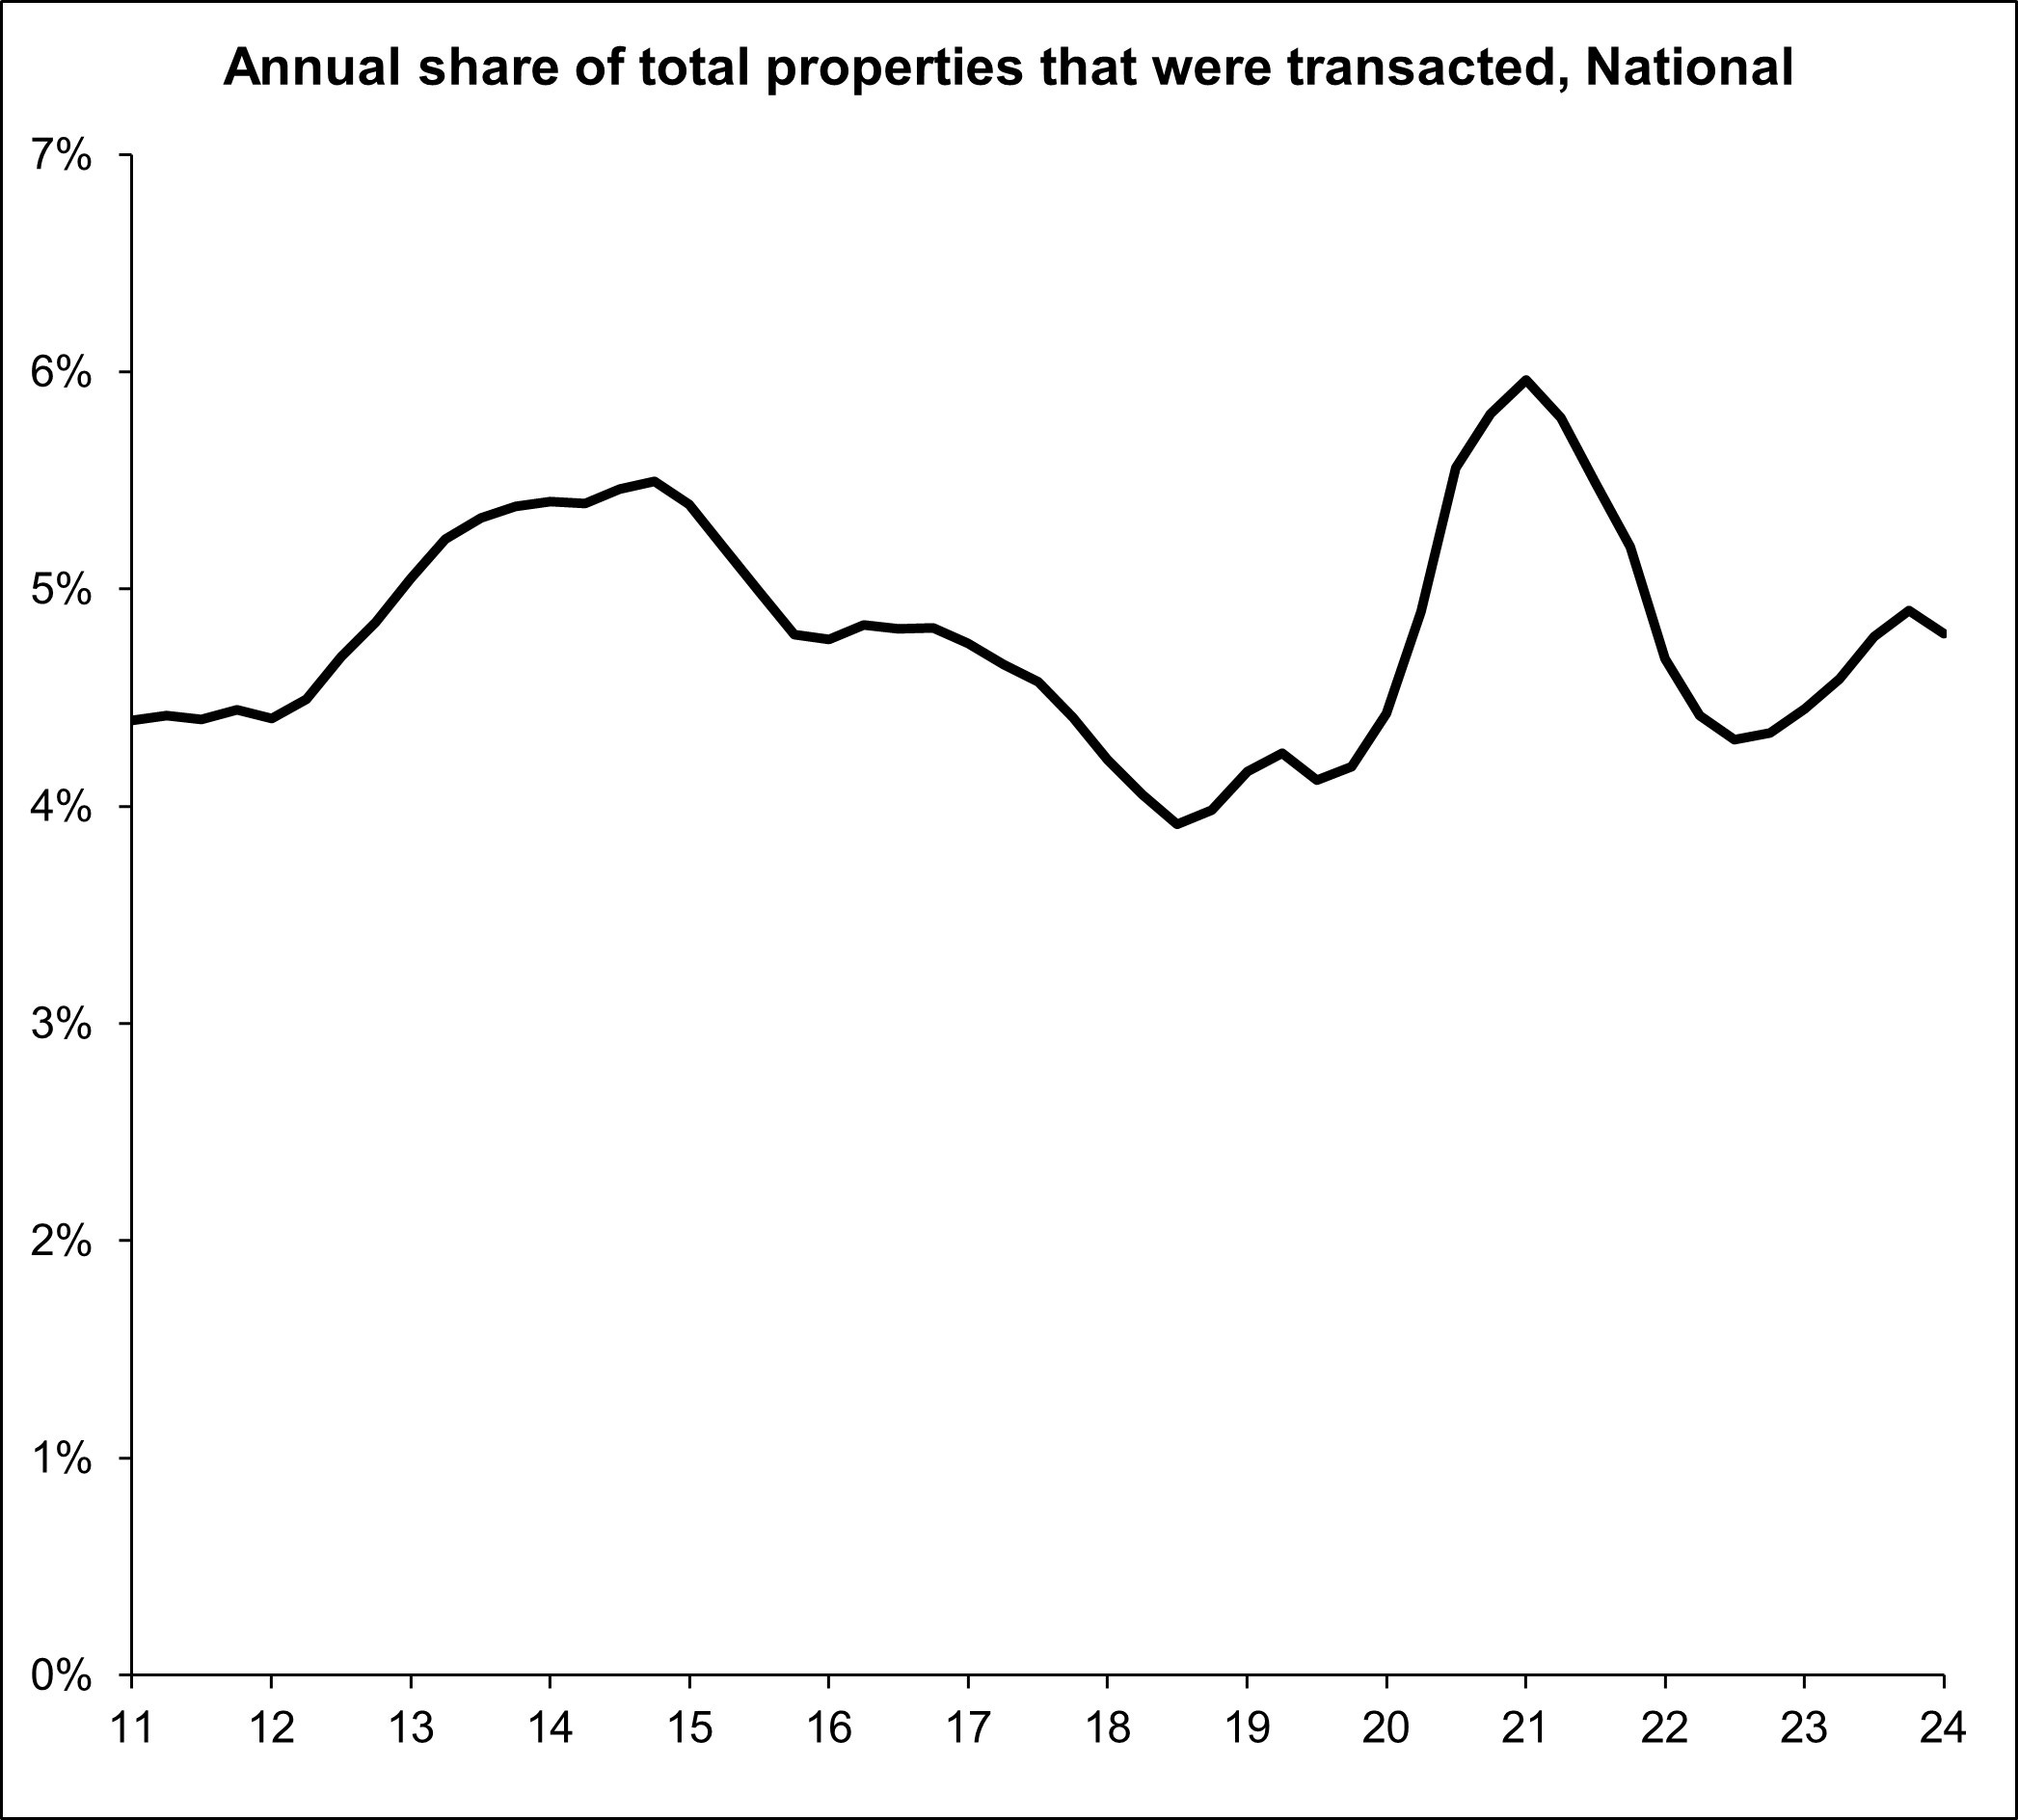
Only around 4.5% of properties sell in any given year, so most households stay in their property for a lot longer than 10 years. Based on turnover, the typical length of ownership is around 22 years so the equity position for many people contemplating upgrading is much stronger than in the scenario shown.
This goes some way to explaining why despite housing costs already being eye-wateringly high, there are still plenty of people prepared to pay for housing at these prices.
Many households have seen a significant increase in their wealth due to the escalation in property values and despite high prices resulting in them having to take on higher levels of debt and pay higher prices to upgrade, they are willing to do so.
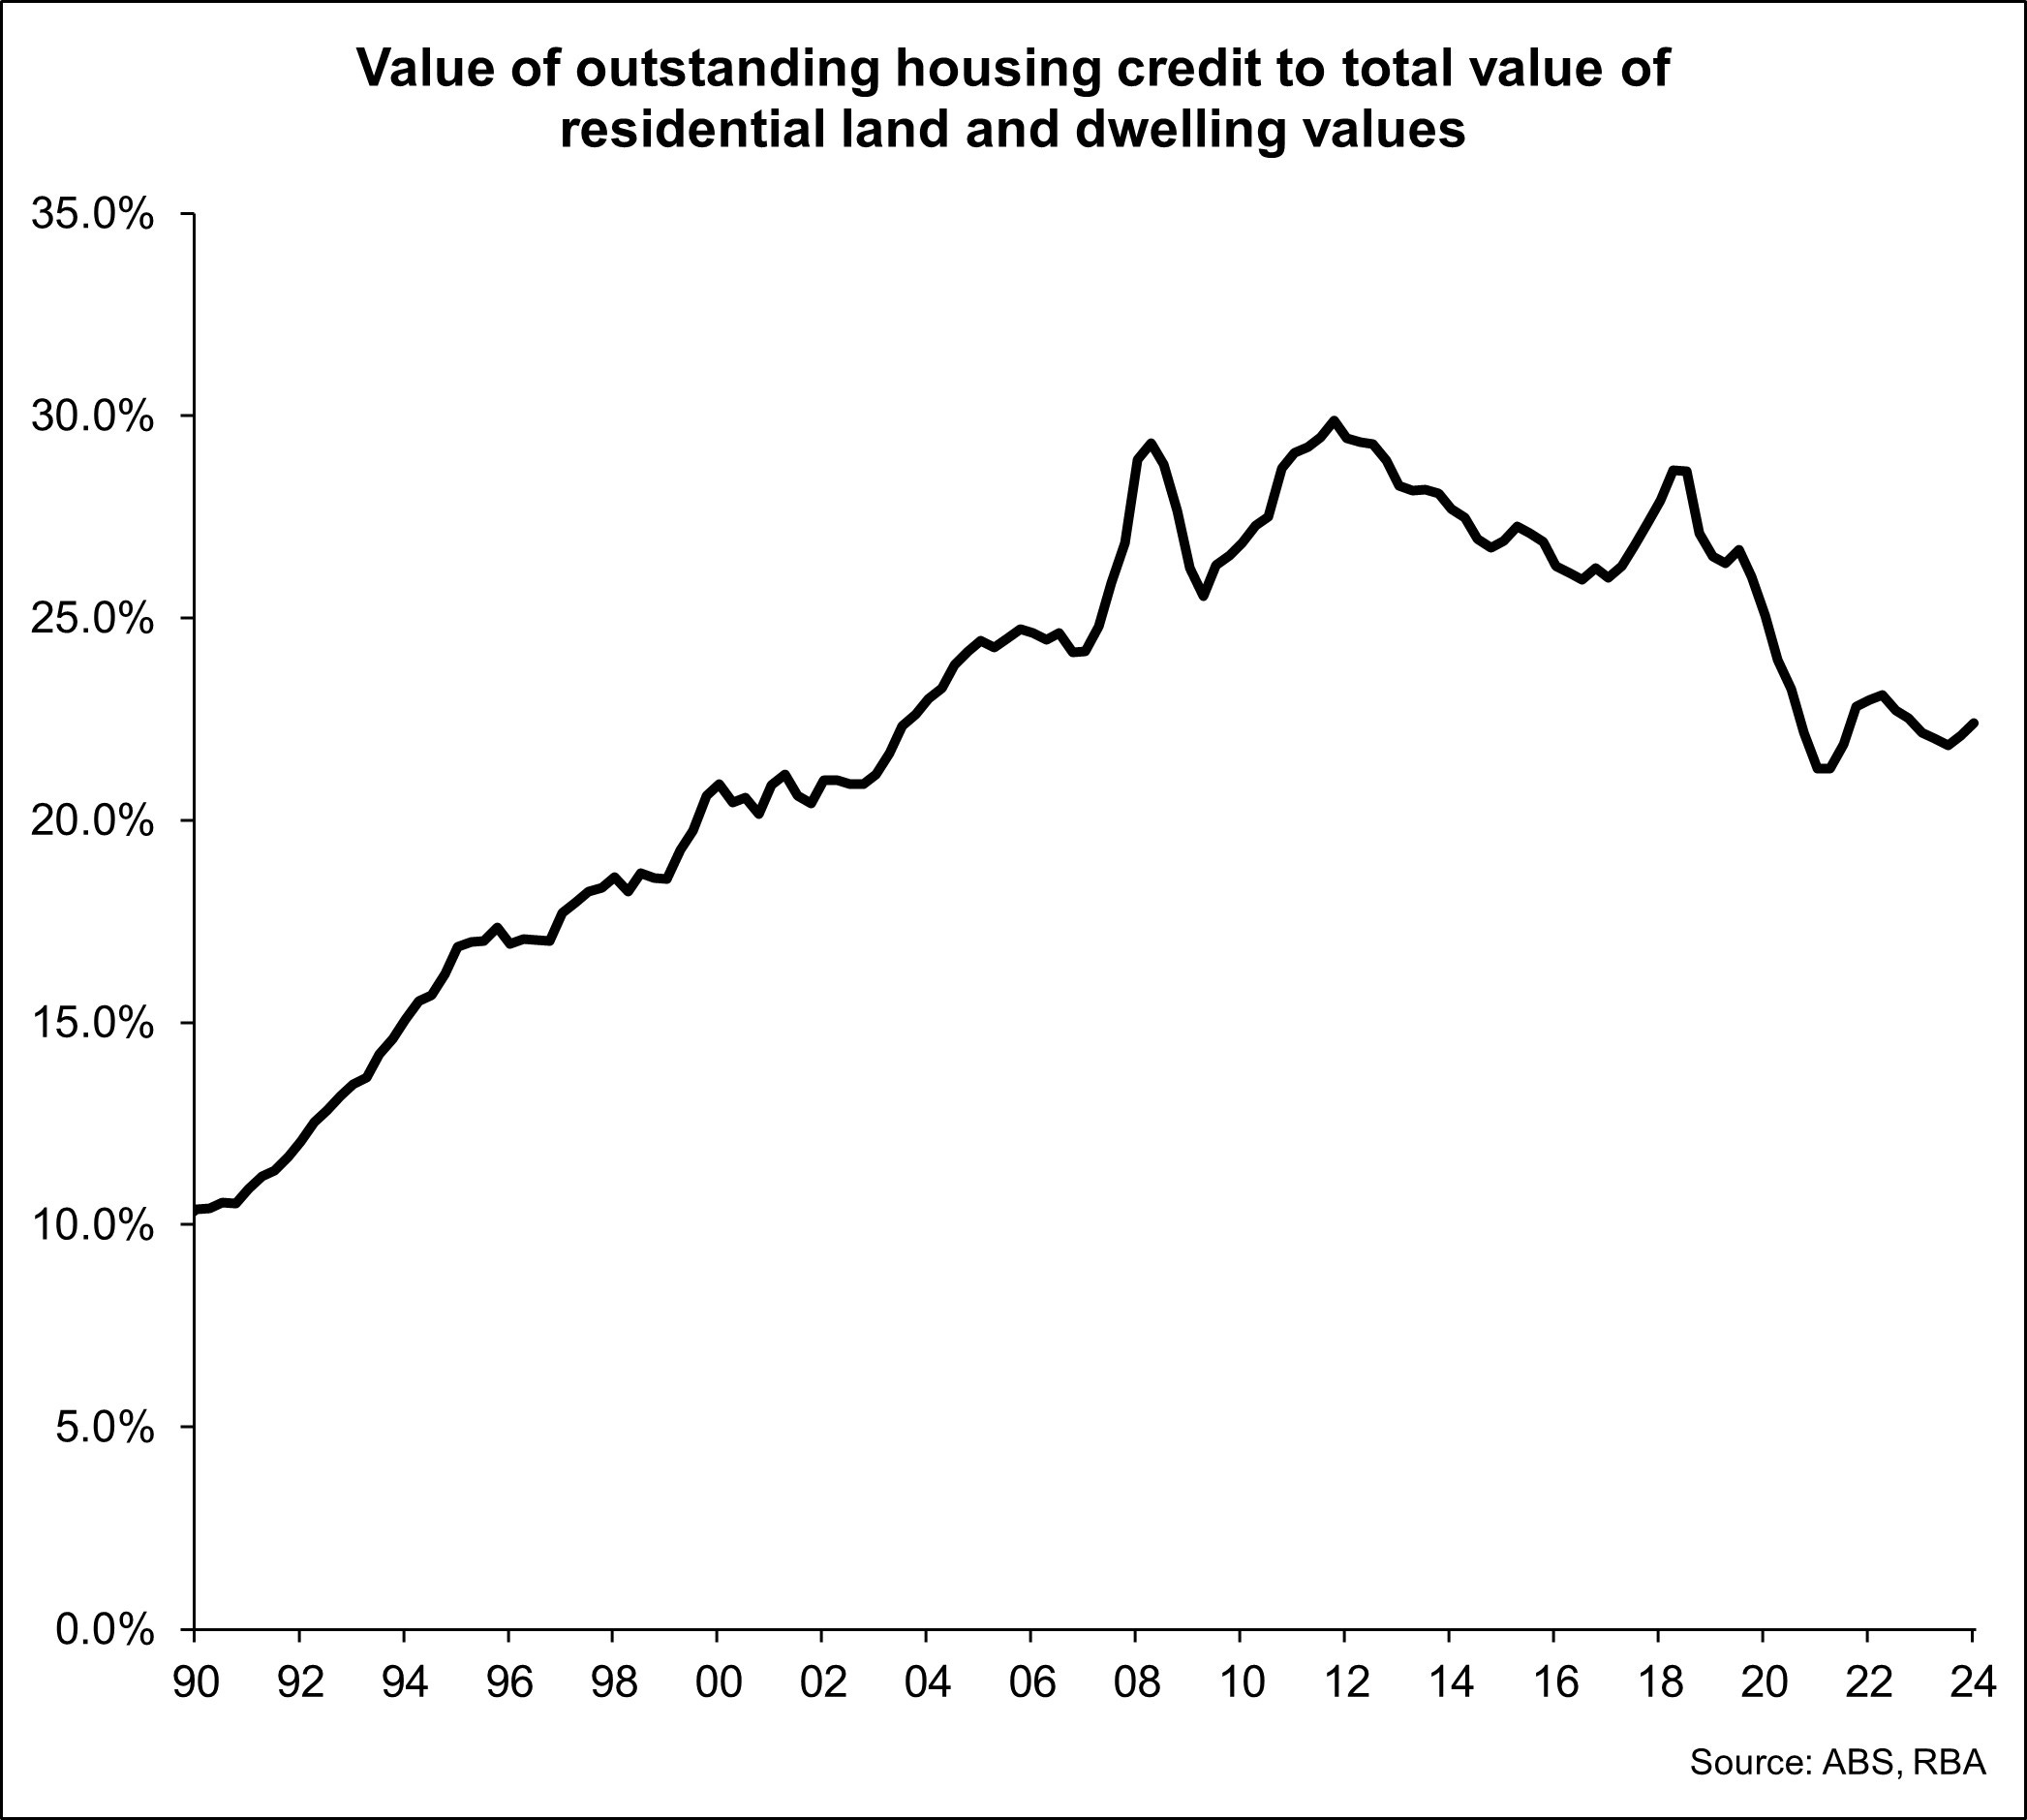
This strong equity position of households is shown in the above chart which looks at total outstanding credit compared to the total value of residential land and dwelling values. The debt associated with housing accounts for 22.4% of the total value of these assets, highlighting that most people have significant equity in their housing assets.
This strong equity position of those people that already own properties makes it very difficult for first home buyers to compete. It’s why more demand-side stimulus, although it is popular, should be avoided by governments because it just makes it even more difficult for the next cohort of first home buyers who then require even greater government and/or family support in order to enter into home ownership.
In conclusion
This data shows that the value of land is the key driver of the increase in home values across the country which has significantly boosted housing equity. That equity position of home owners is the main enabler of people continuing to be willing and able to pay higher prices for shelter.
Until such time as more home owners haven’t seen a significant increase in their equity enabling them to upgrade and reinvest, it’s hard to imagine a sustainable reduction in property prices.
The analysis also highlights that land values are the key driver of the increase in home values and housing assets. If we are serious about lowering prices (I don’t think politicians are) or slowing the growth in home values, the key is reducing land prices or at the very least slowing land price escalation.
While people continue to have significant equity in their home and while that equity continues to grow, it remains difficult to see a situation whereby the cost of housing significantly and permanently reduces outside of some unforeseen circumstances. The alternative way in which to lower prices would be a deliberate political or lending policy changes which again doesn’t seem likely to happen.
Until we try something different, it seems inevitable that the longer term trend will see the cost of housing continue on its upward march. Resulting in falling rates of homeownership, especially for younger people and those that can enter into homeownership increasingly relying on government and familial support to do so.
I’d love to hear your thoughts. Do you agree with this analysis, what should governments be doing differently?
Thanks, very interesting analysis, and I agree that land price escalation is the key issue. I understand that in the 1950s, land cost was c10% of the value of house + land, and now it is c50-50%. The cost base of land has increased due to planning induced restrictions and cost shifting of infrastructure onto home buyers, as well as higher minimum standards. They are areas that governments could address. Time to revisit the classic text: “A Mansion or No House”.
Hey Cameron - check this link out re land values climbing from the late 1990's...
https://www.macrobusiness.com.au/2011/09/how-the-cpi-hid-the-housing-bubble-2/
"If home ownership is a policy goal, cost of living indexes should treat home buying and renting households separately. This will ensure that any policy aimed at making home owning more attractive can be evaluated by comparing these metrics."