


Council Approval Tracker
February 2025 data

The latest building approvals data revealed that annual dwelling approvals nationally reached 178,578 in Feb 25 which was +8.4% over the year and the highest annual number of approvals since May 23.
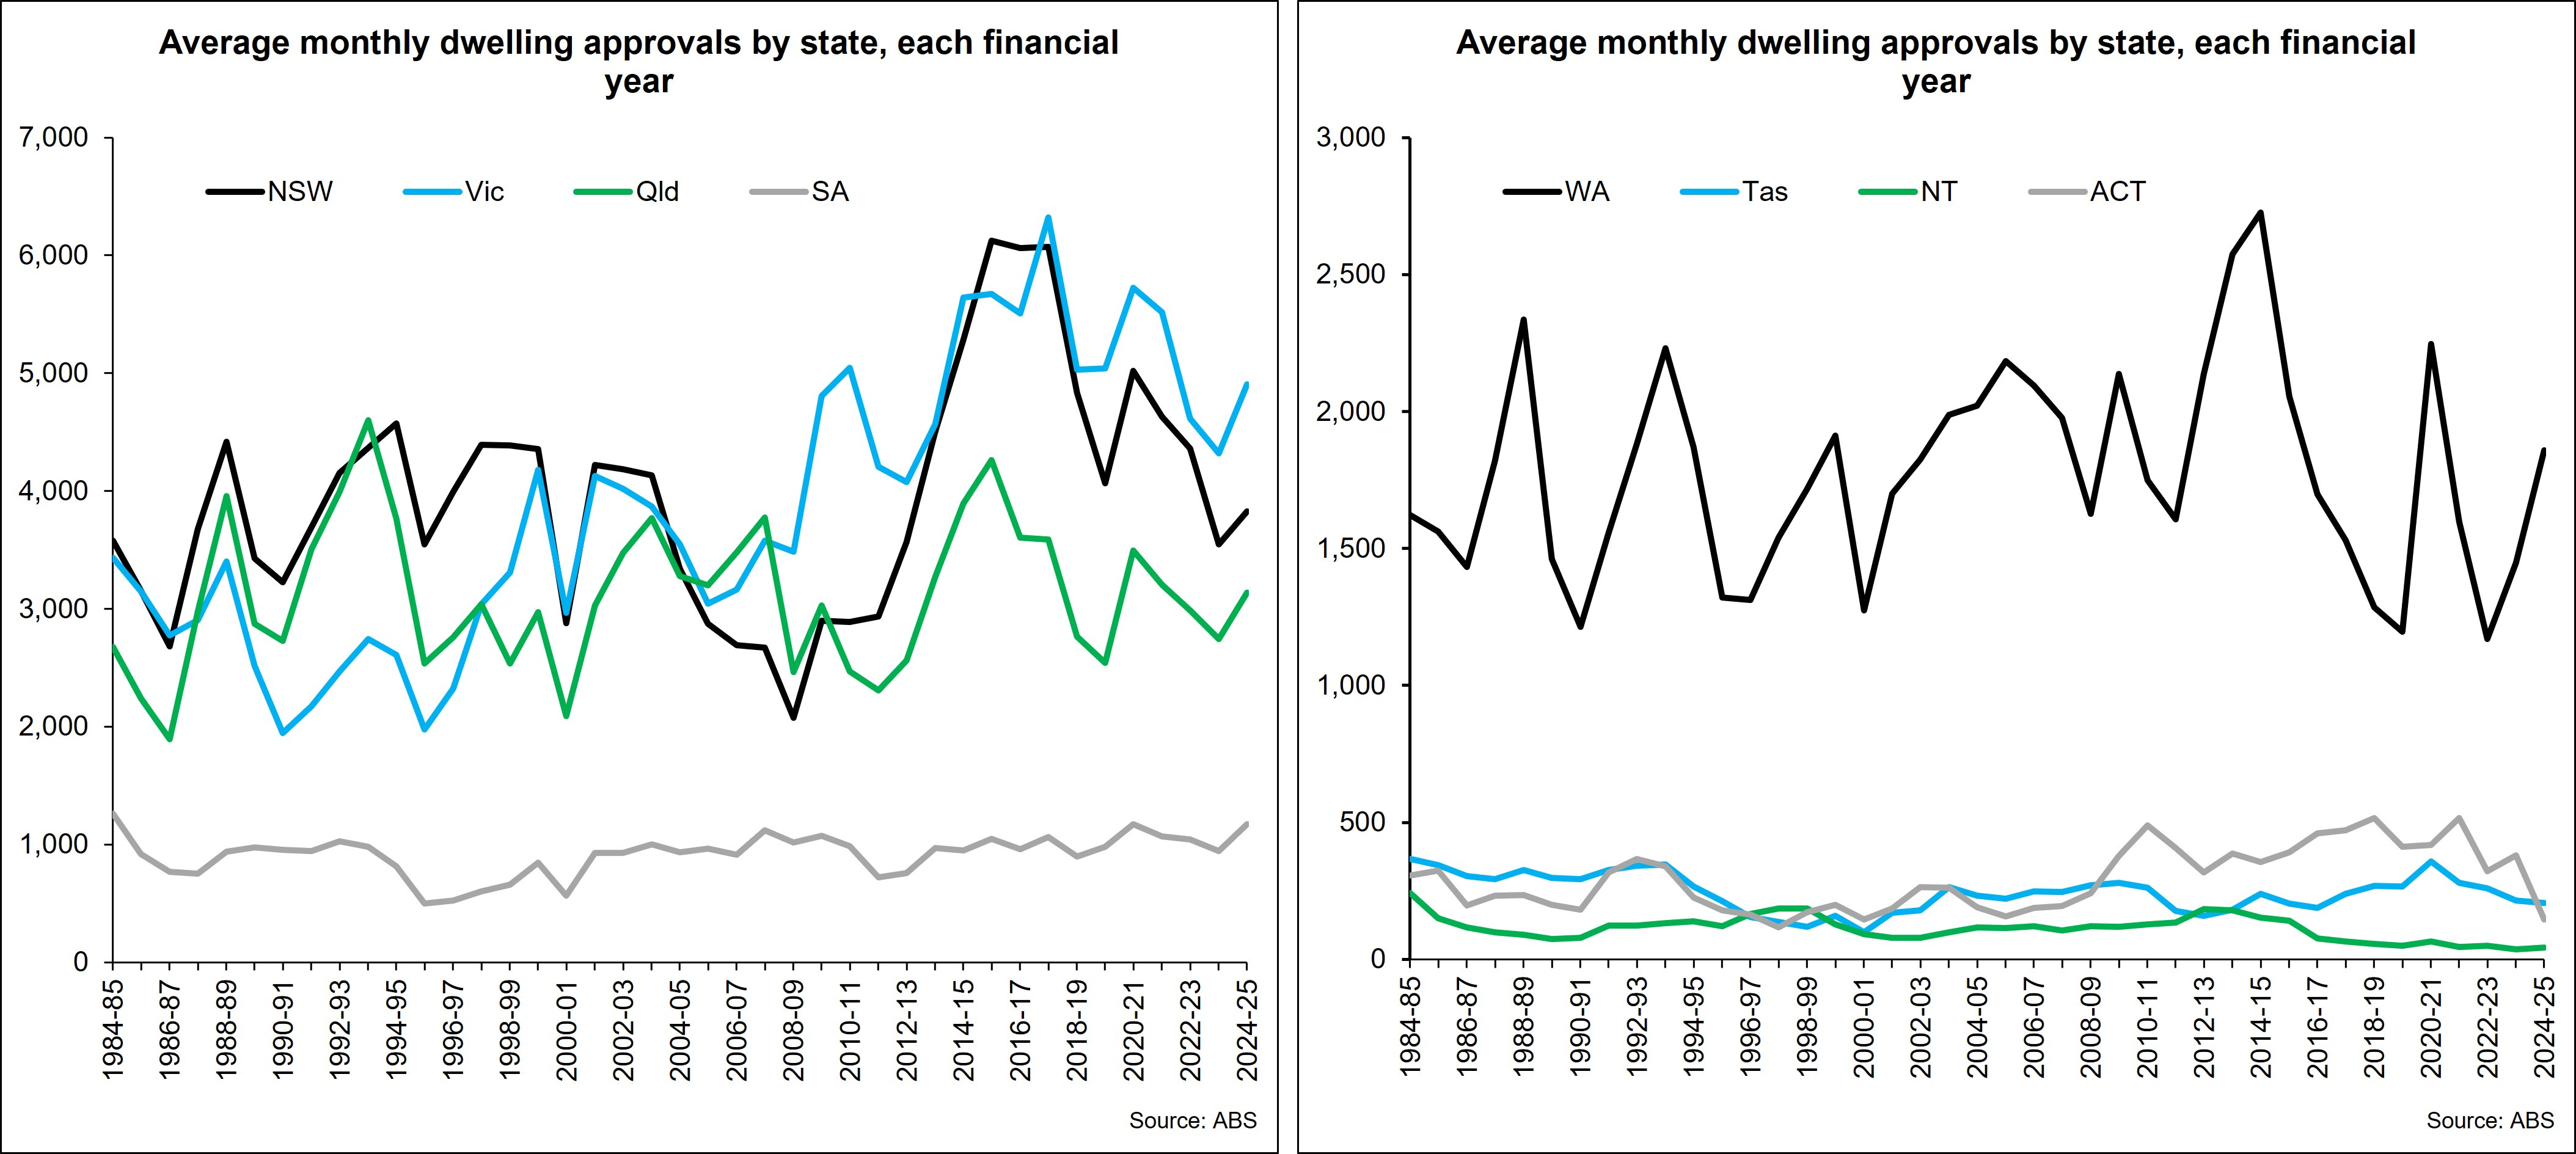
Looking at the run-rate of dwelling approvals so far this financial year across each state and territory, average monthly approvals are higher in most markets with Tas (-4.2%) and ACT (-61.6%) the exceptions. The greatest increases in average monthly dwelling approvals this financial year compared to last was in WA (+28.3%) and SA (+24.1%) which perhaps coincidentally are the markets where established home prices have been rising fastest for several years now. They are also the markets with the lowest supply of established properties for sale relative to their longer-term average.
Although average monthly dwelling approvals have generally increases over the past year, they still sit across most states and territories well below recent highs. This reflects the ongoing challenges of delivering new housing in a high cost and relatively high interest rate environment. In fact, when approvals were most abundant, it was a time of low and falling interest rates and low cost inflation.
Despite the fact approvals are still below their previous highs, it is encouraging to see there has been an uplift which reflects demand for new housing product as well as more developers being able to secure sufficient presales and finance for their projects.
Let’s now look at each of the states and the larger council areas that have seen the largest and smallest changes in average monthly dwelling approvals in the current financial year compared to the previous one.
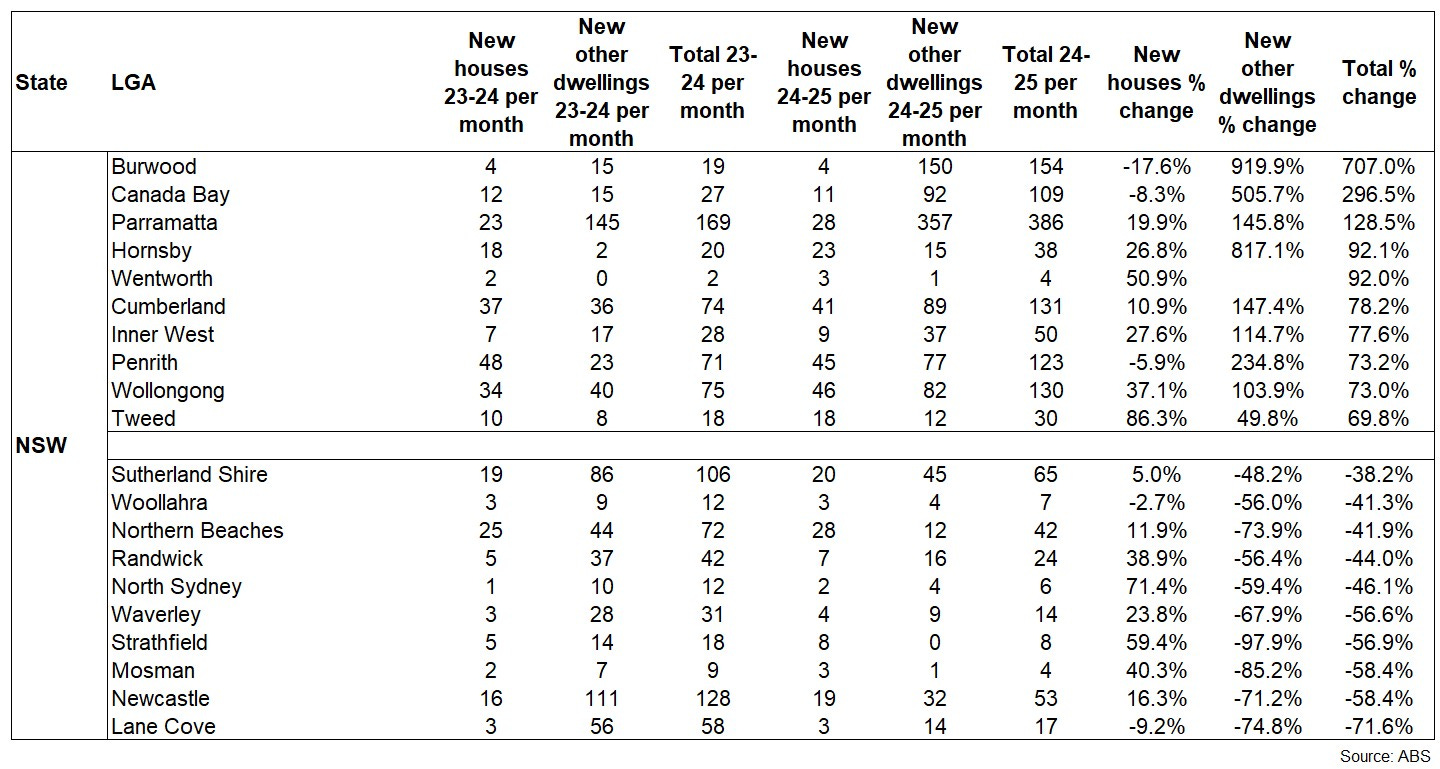
On average so far this financial year NSW have approved 3,826 dwellings a month which is +7.9% compared to the previous financial year but lower than the 4,359 approvals a month in the 2022-23 financial year. This is split between 1,797 house approvals per month (-4.9% compared to last financial year) and 2,029 other dwelling approvals per month (+22.7% compared to last financial year).
The above table highlights that the increase in approvals is certainly not uniform. Burwood, Canada Bay, Parramatta, Hornsby and Wentworth have seen the largest increases in average monthly approvals with the top 3 areas having seen approvals more than double. On the other hand, average monthly approvals in Lane Cove, Newcastle, Mosman, Strathfield and Waverley have fallen by more than a half compared to last financial year.
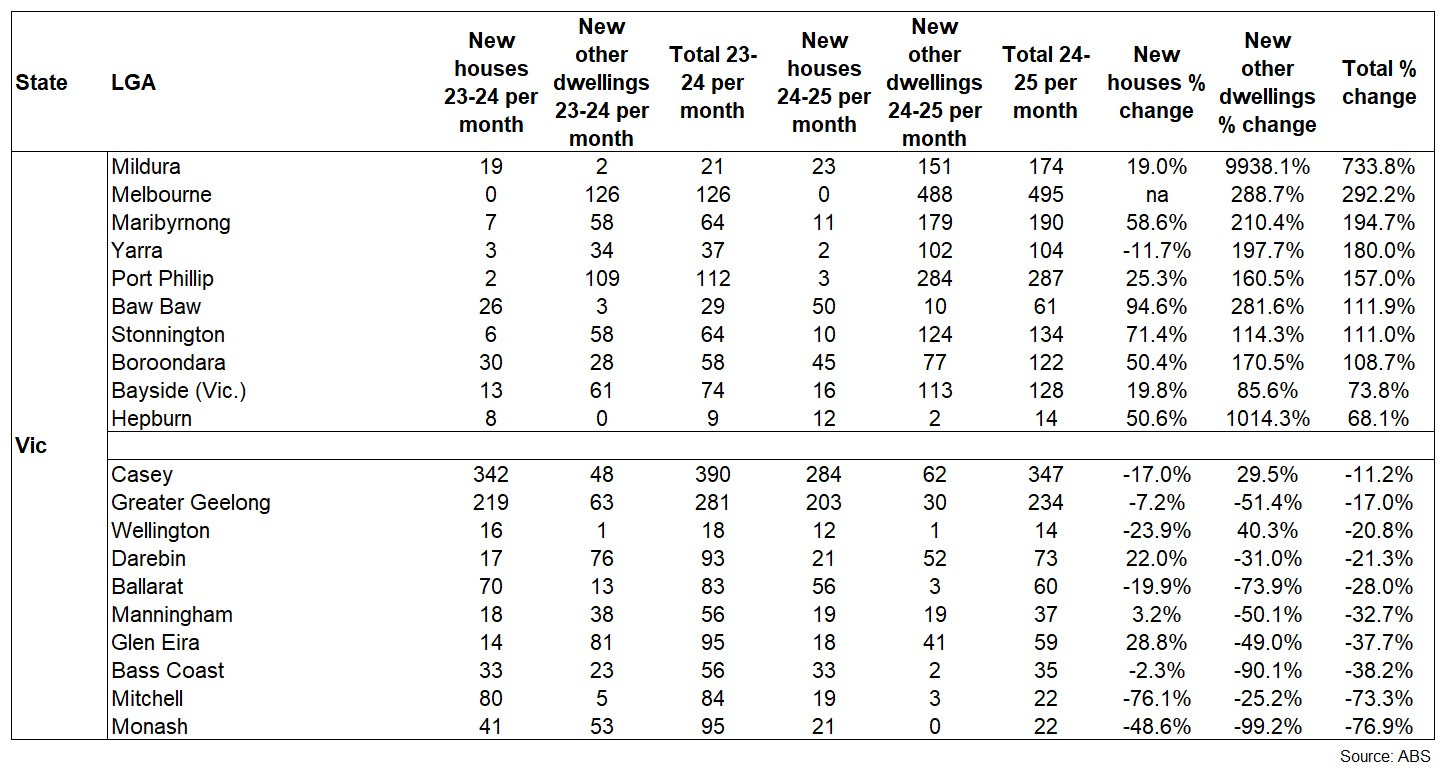
Vic has seen an average of 4,904 dwelling approvals a month which is +13.6% compared to the previous financial year and it’s highest average since 2021-22 (5,515/month average). The state is averaging 2,763 house approvals per month and 2,141 other dwelling approvals per month with these figures -0.7% and +39.5% respectively compared to average monthly volumes last financial year.
As was the case in NSW, not all areas are necessarily pulling their weight however, the top 8 areas listed above have all seen average monthly approval numbers more than double relative to the previous year, with other dwellings the main driver of this growth. Looking at the worst performers, average monthly approvals have fallen by more than half over the year in Monash and Mitchell.
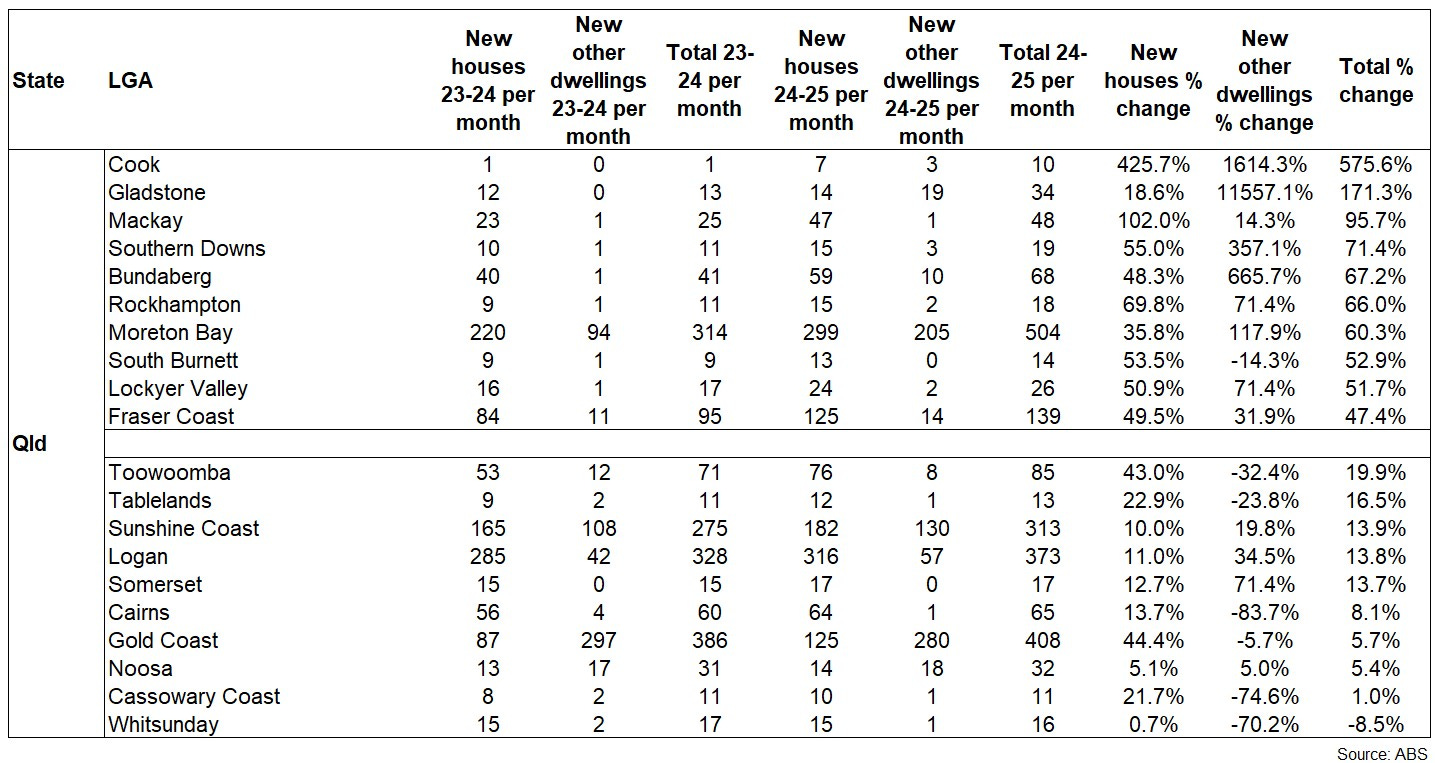
So far in the 2024-25 financial year there has been an average of 3,135 dwelling approvals a month in Qld which is the highest volume since 2021-22 and +14.3% compared to the average over the 2023-24 financial year. House approvals have averaged 2,038/month which is +12.5% compared to the previous year and other dwelling approvals have averaged 1,097/month which is +17.8% compared to last year.
Council areas outside of Greater Brisbane account for nine of the 10 regions that have seen the greatest uplift in approvals over the year, although Southern Downs and Lockyer Valley are adjacent to the capital city. Encouragingly, Whitsunday is the only significant council area in the state in which average monthly approvals are lower than a year ago but clearly it would be encouraging to see more of an uplift in approvals in some of the South East Queensland council areas given how strong housing demand is.
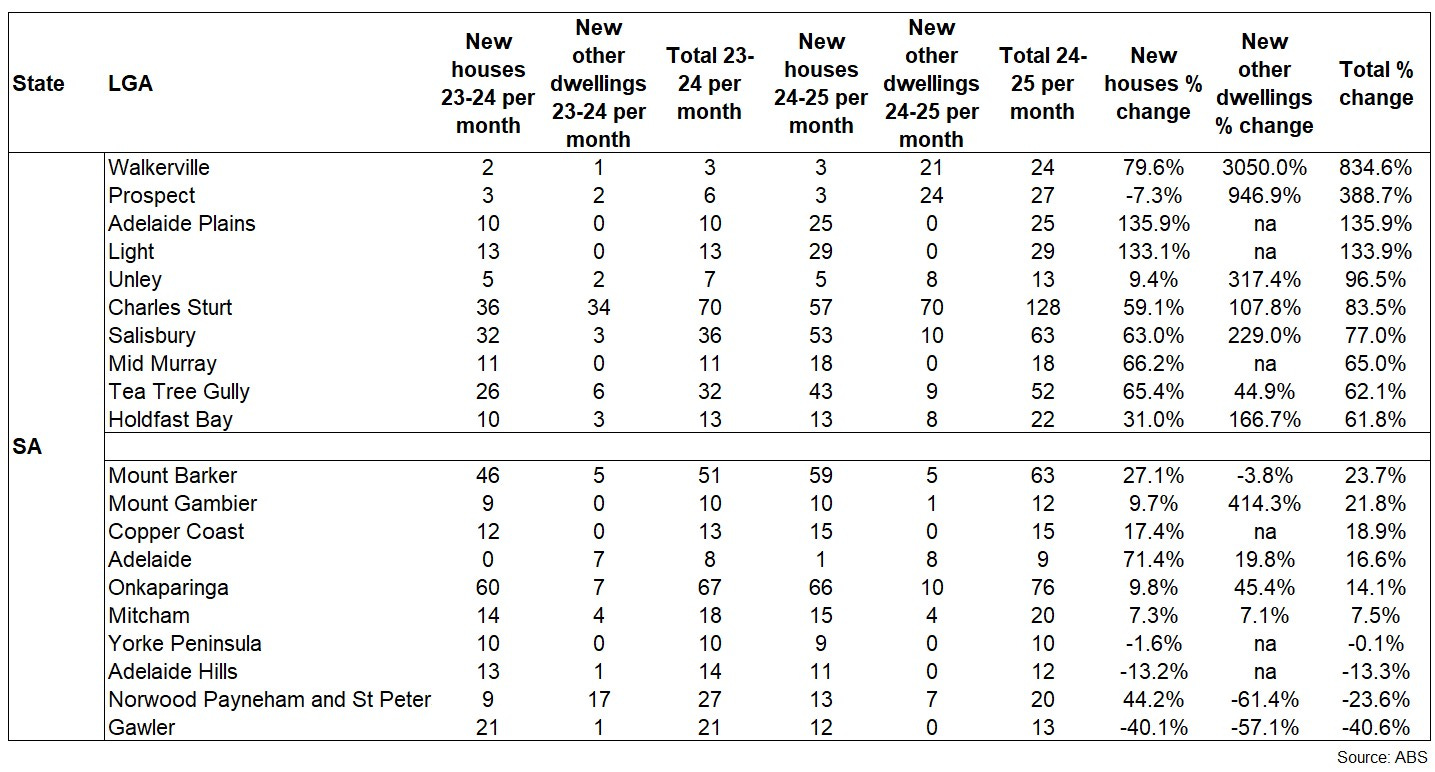
SA has averaged 1,170 dwelling approvals per month so far over the current financial year, which is +24.1% compared to last year and the highest volume since 2020-21. House approvals have averaged 896/month which is +20.7% over the year and other dwelling approvals have averaged 274/month which is +36.6% over the year.
Each of Walkerville, Prospect, Adelaide Plains and Light have seen more than a doubling of average monthly approvals compared to last year. Charles Sturt LGA is delivering a significant volume of approvals and has increased approvals by 83.5% over the year. Only four of the council areas listed have recorded fewer average dwelling approvals this year compared to last which signifies a fairly significant and broad lift in approvals so far this year.
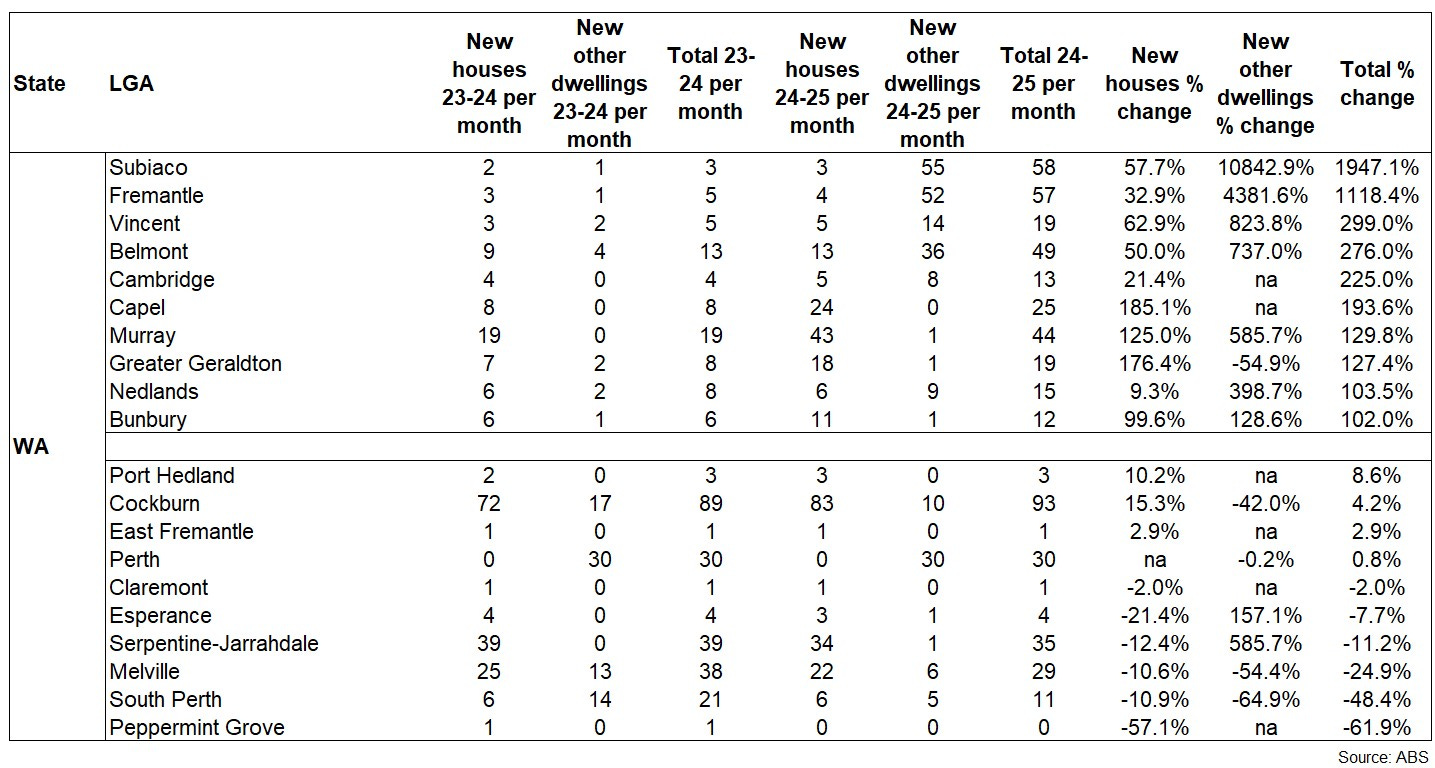
The average number of dwellings approved each month in WA so far this current financial year is 1,858 which is +28.3% compared to last financial year and the highest average monthly volume since 2020-21. This volume of approvals is comprised of an average of 1,520 house approvals per month and 338 other dwelling approvals per month. These figures are +21.4% and +72.8% respectively compared to the previous year.
Each of the top 10 regions listed in the above table have seen the average monthly number of dwelling approvals more than double compared to last year with Subiaco and Fremantle seeing more than 10 times more approvals on average per month, with the increase mostly driven by other dwellings. The lift in approvals throughout WA has been quite broad-based with only six council areas listed seeing a fall in approvals compared to last year.
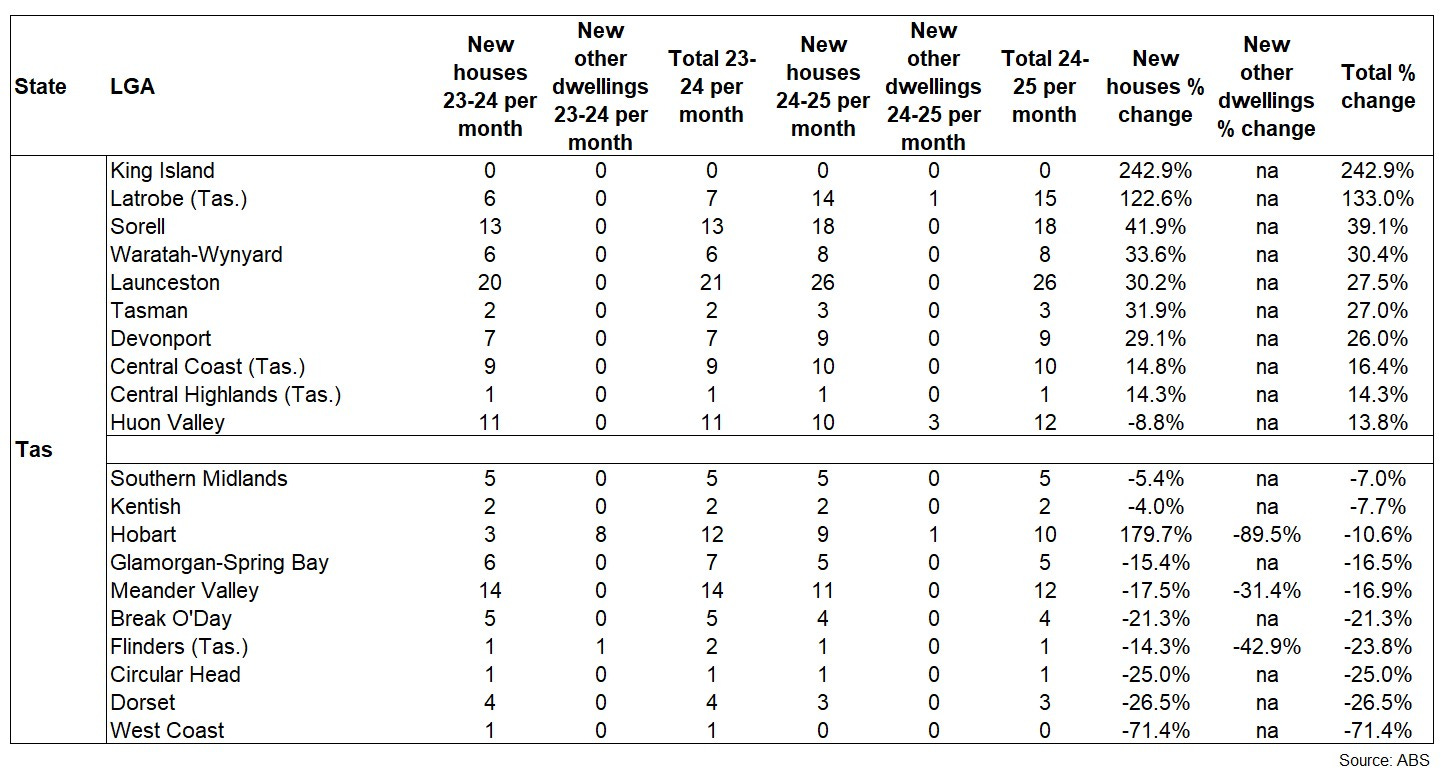
Tas has averaged 205 dwelling approvals per month so far in the current financial year which is -4.2% compared to 2023-24 and the lowest average monthly approvals since 2016-17. The average volume consists of 197 house approvals per month which is -2.4% compared to last year and 9 other dwelling approvals per month which is -32.9% compared to last year.
Only King Island and Latrobe have recorded a doubling of approvals over the year while many regions of the state have seen declining approvals numbers. What is very noticeable is the focus on house approvals and in many areas a complete lack of other dwelling approvals being sought. You can’t help but think such a low supply of new stock being approved will lead to a future undersupply of housing in Tas.
What does this all mean?
It’s encouraging to see that at a national level and in most states there has been an uplift in dwelling approvals which is necessary if we are to hit our housing targets. In saying that, not one state or territory has approved on average enough new dwellings each month to hit their Housing Accord target, Vic is the closes just -3.9% from the target.
Of course an approval is no guarantee of a commencement or a completion so in order to achieve the Housing Accord targets we should be approving 10% to 20% more than what is required to be built.
Some state governments are addressing planning constraints which will assist in delivering more new housing however, construction costs remain elevated making new housing more expensive than established homes and financing costs for developers and builders remain elevated keeping developer margins under pressure and making many new projects unviable currently.
As interest rates fall (at the time of writing 100 basis points worth of interest rate cuts were expected by the market this year) and assuming that construction cost escalation remains contained (although tariffs could impact this) then it is likely we will see a further uplift in dwelling approvals and construction throughout the year.
Please let me know your thoughts.