


Capital city and regional market population growth slowed in the 2023-24 financial year
The latest Regional Population data from the ABS showed a significant slowdown in the rate of population growth in capital cities and a marginal slowing regionally.

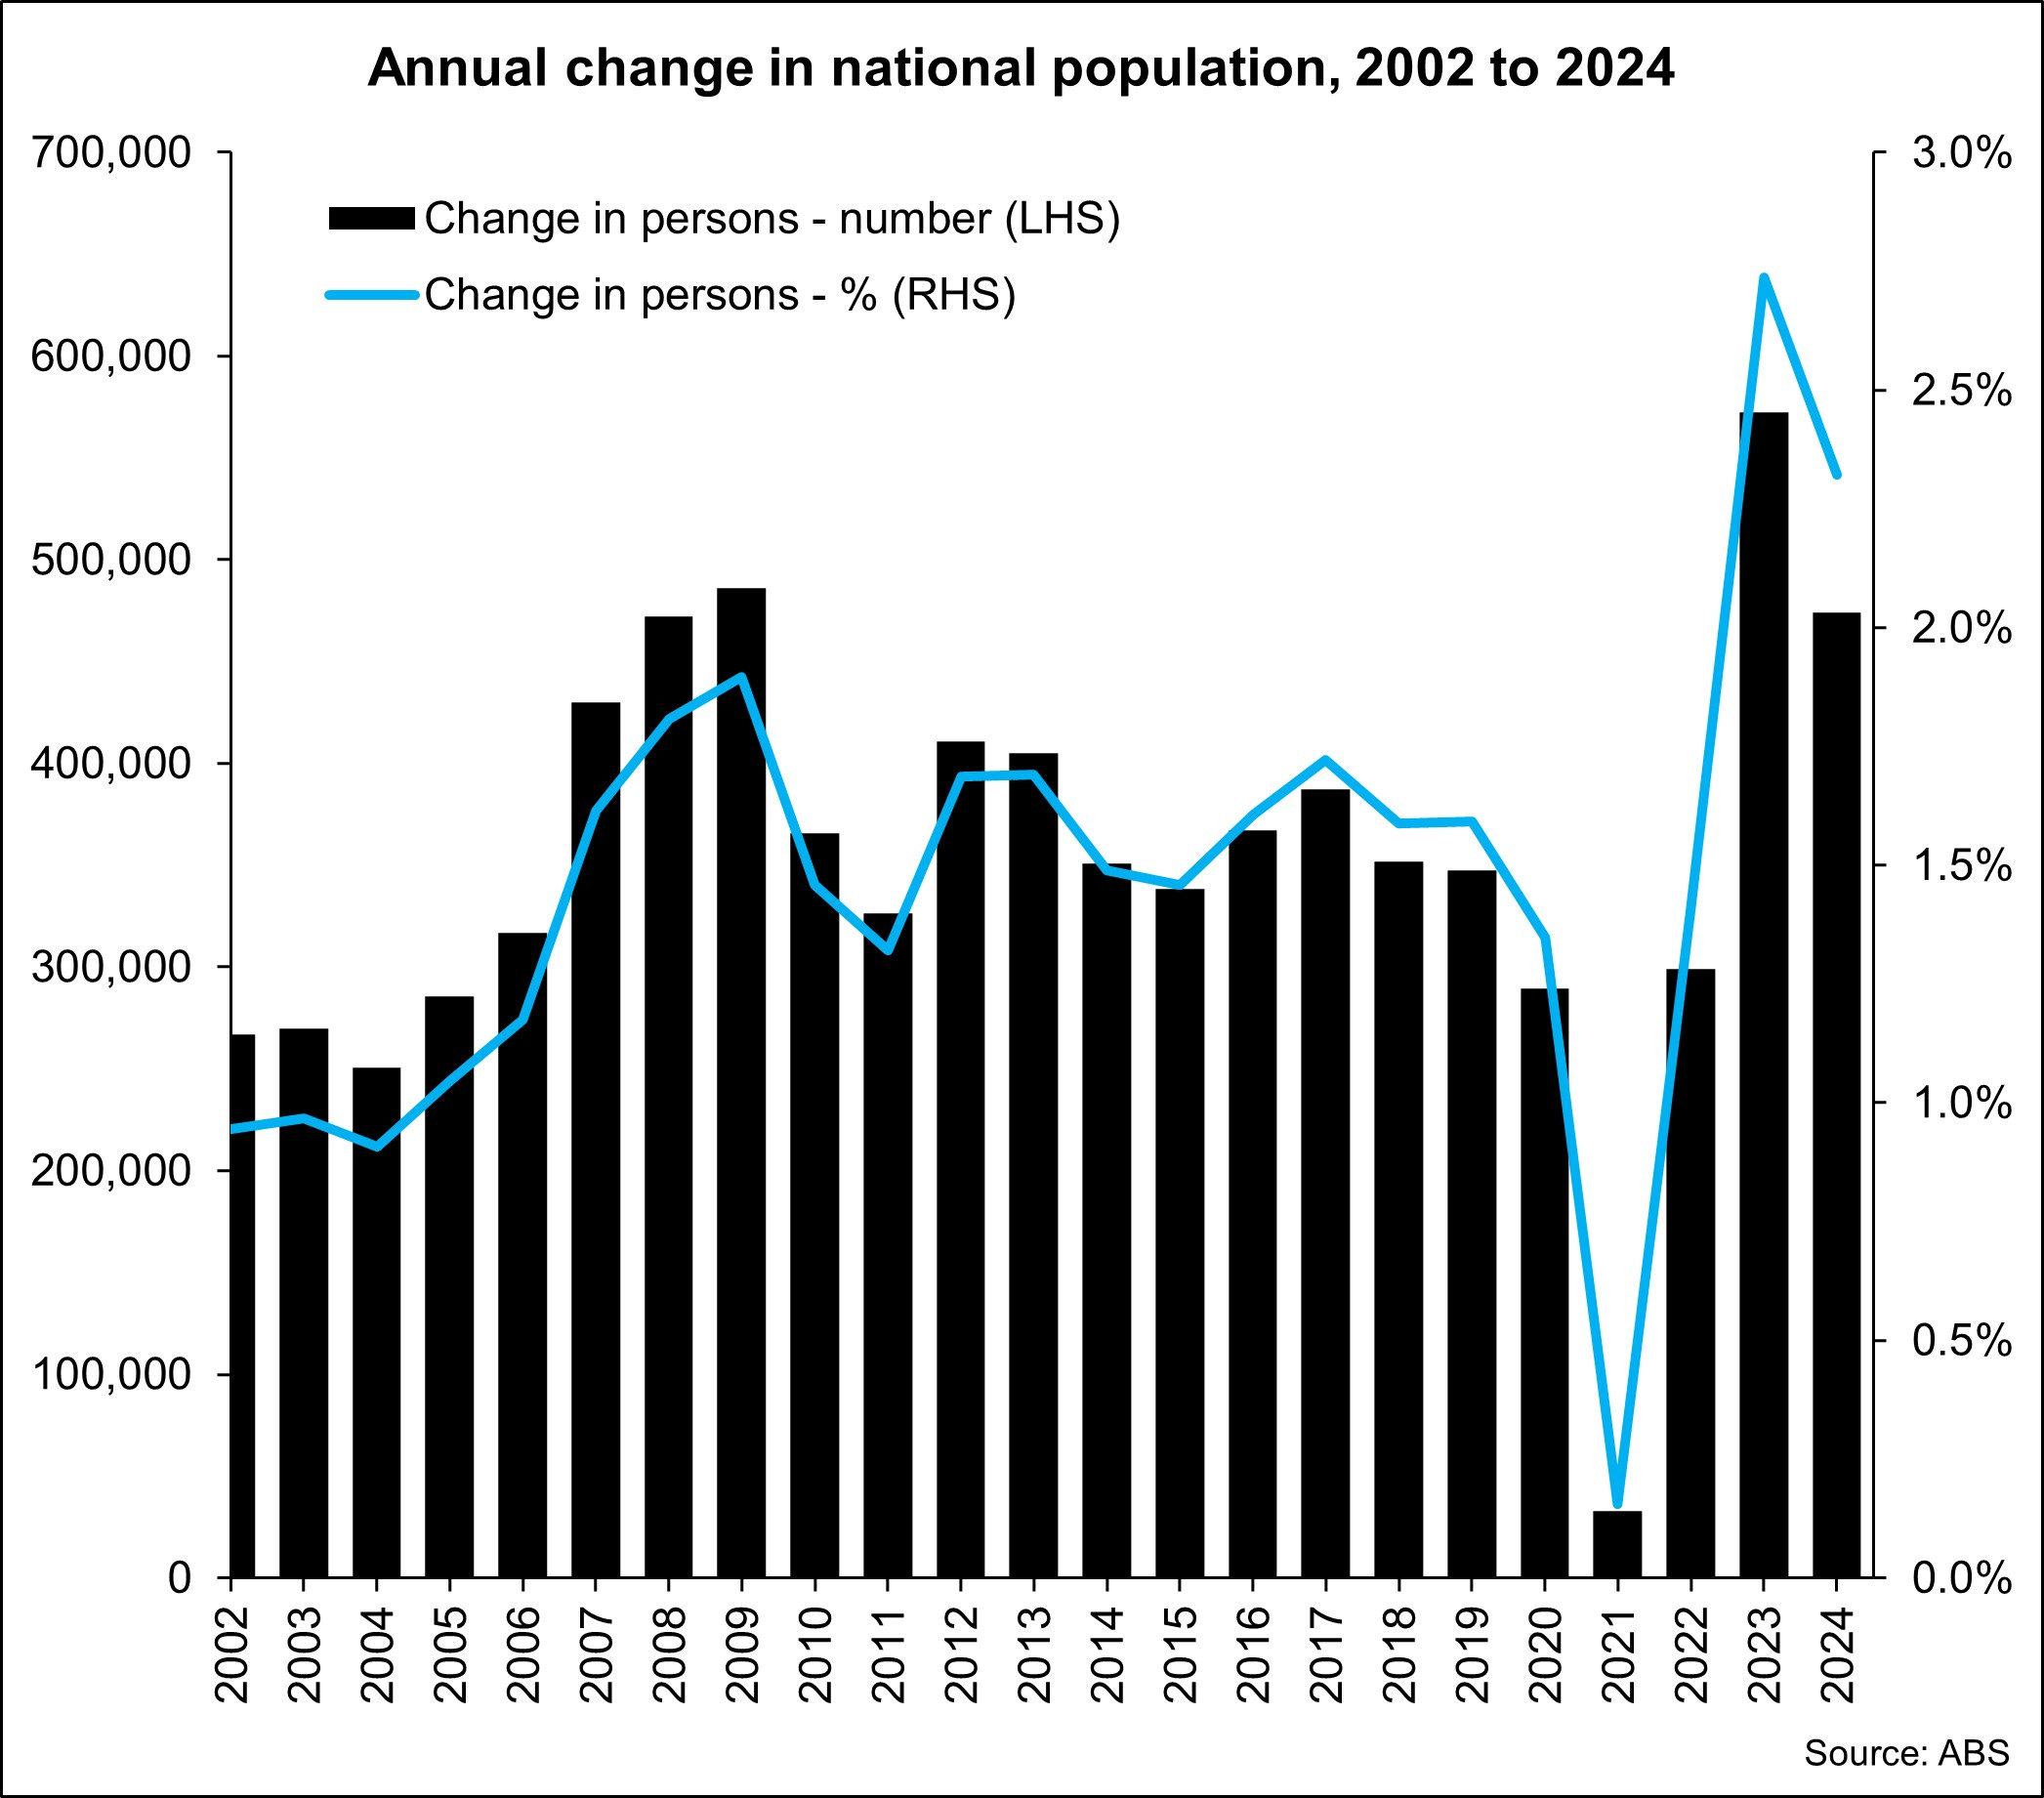
Based on data released last week by the Australian Bureau of Statistics (ABS), the national population increased by 2% over the year to Jun 24, or an increase of 541,592 persons. While this rate of growth remained well above long-term average levels it was a step-down from the previous year when the population rose by 2.5% or 638,378 persons.
It’s also quite telling to look at the changes between the combined capital cities and the combined regional markets. Over the past year, the rate of population growth in the capital cities was 2.4% (427,781 persons) down from 3% (520,926 persons) the previous year while regional markets saw their population increase 1.3% (113,811) in Jun 24 compared to 1.4% (117,452) the previous year.
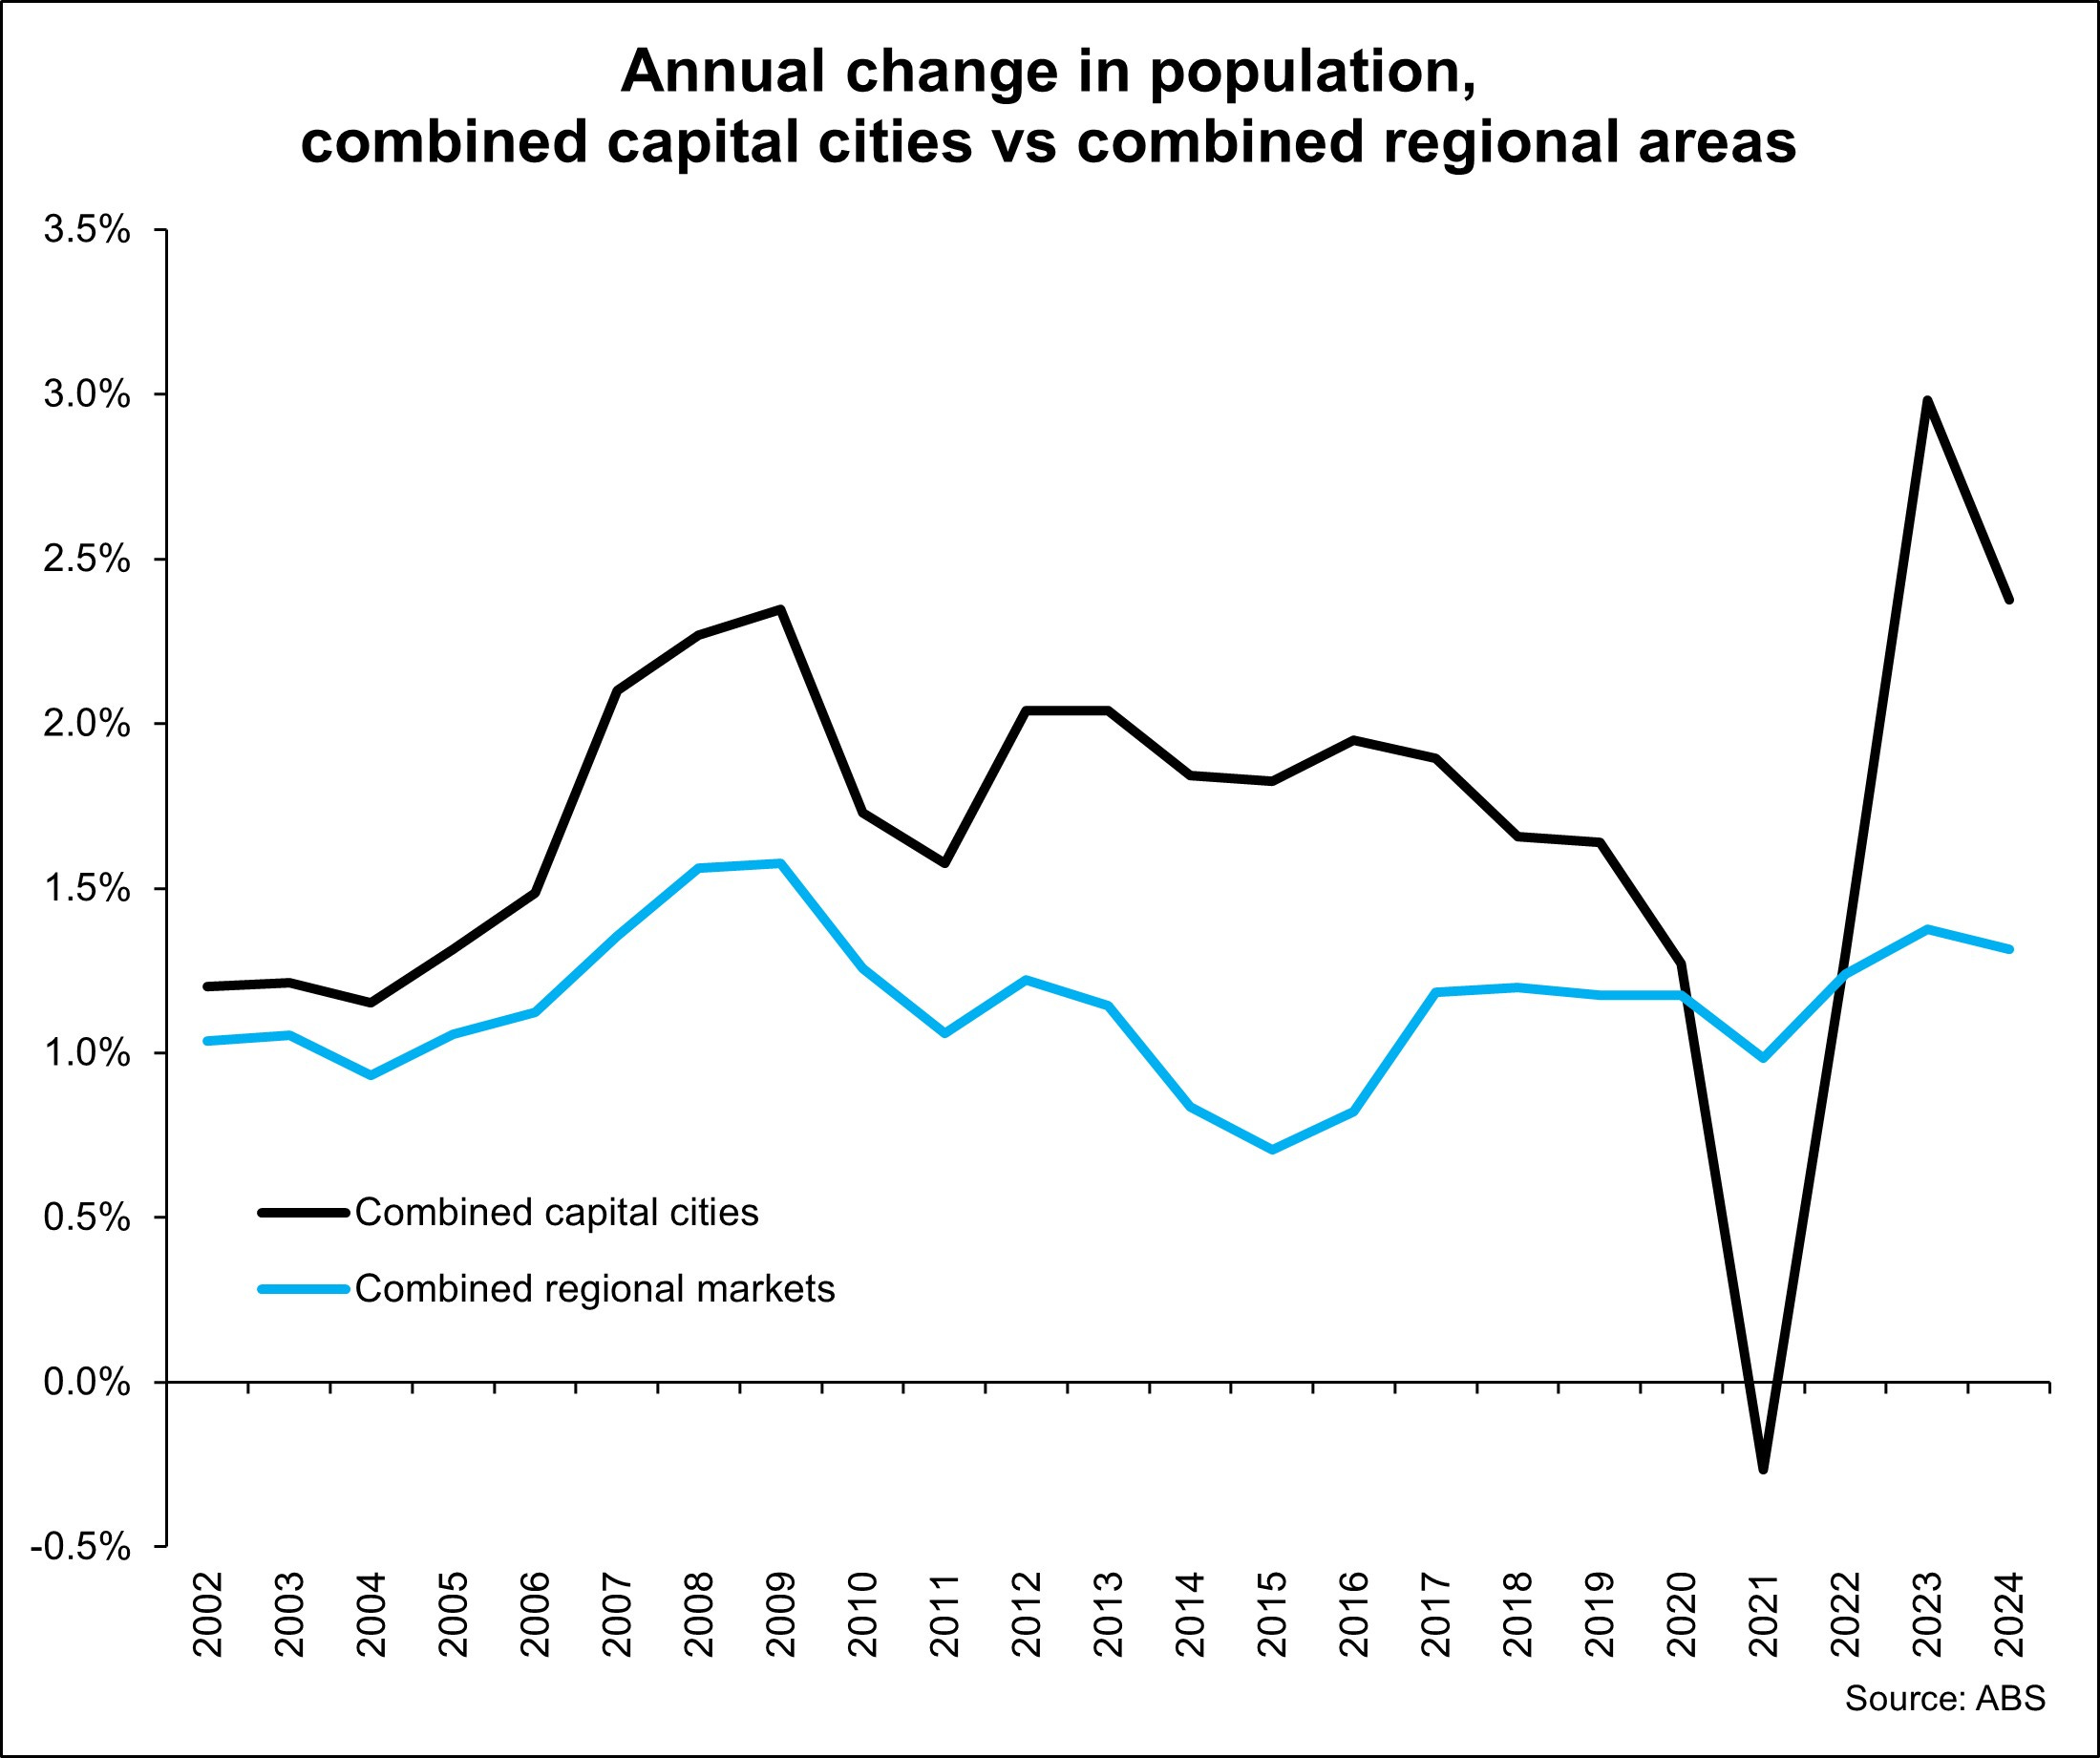
It is interesting to note in the above chart how regional population growth has been significantly more stable than that of the capital cities.
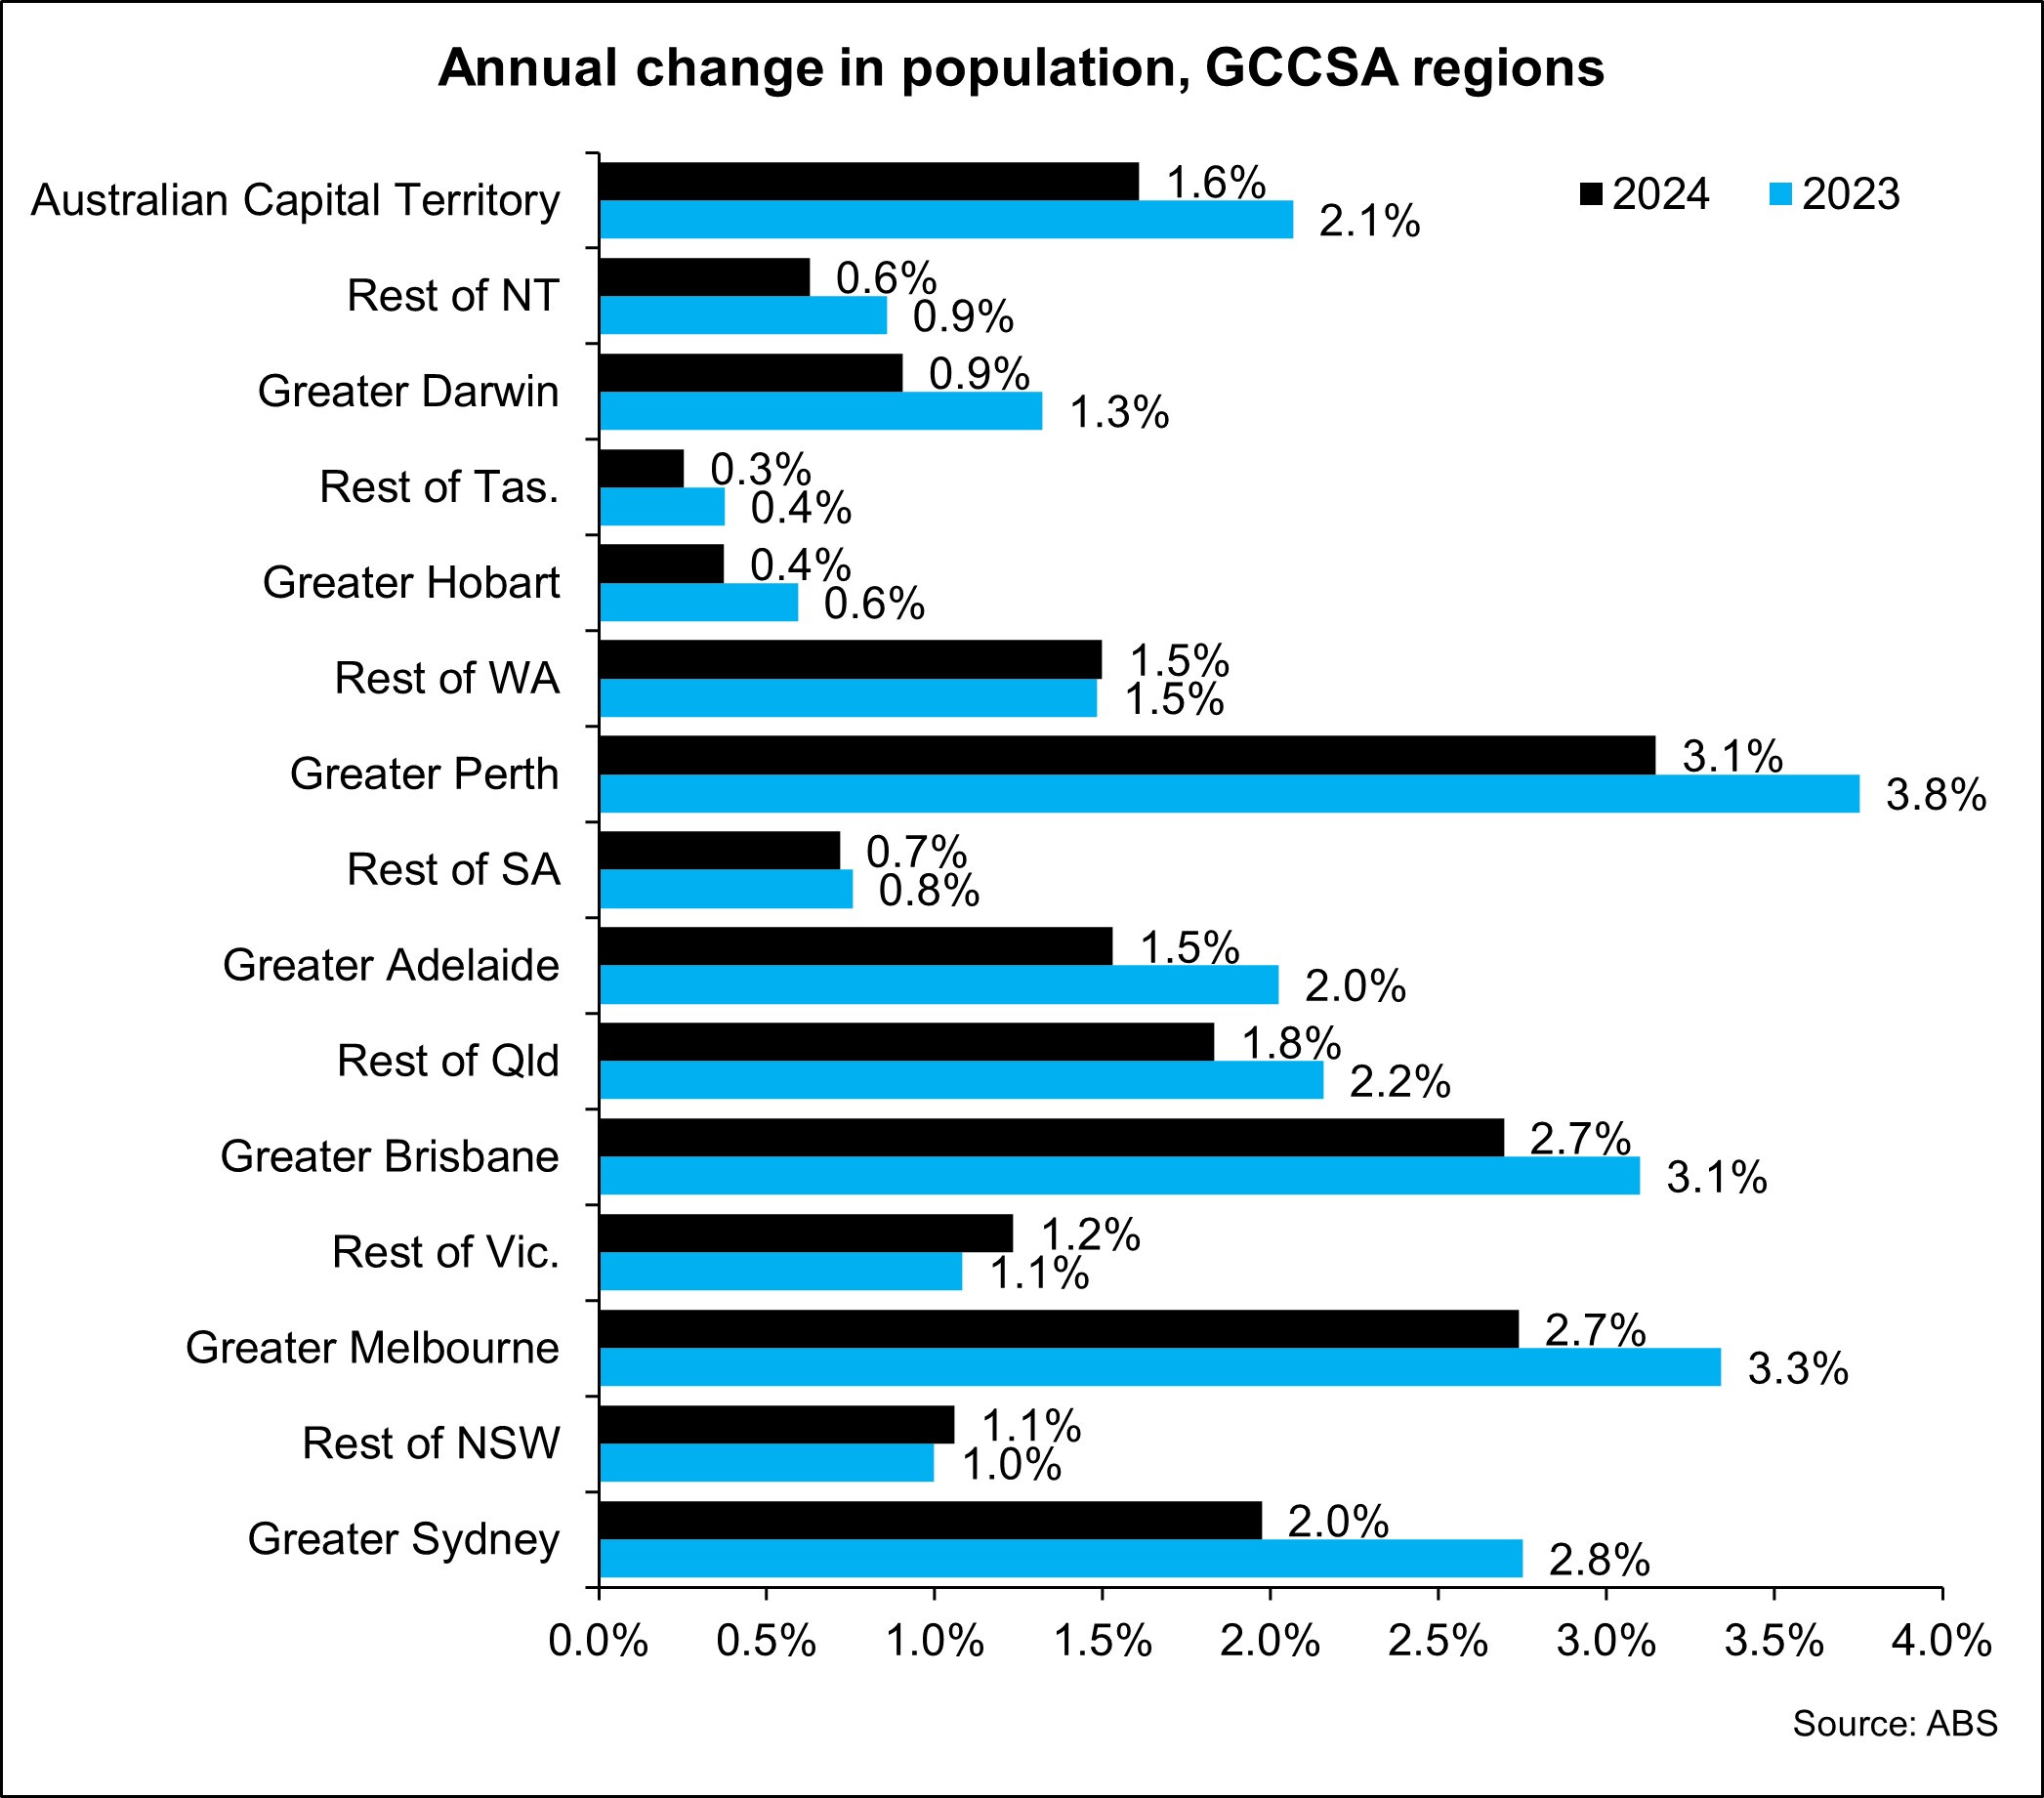
The large stepdown in population growth in capital cities over the past year relative to regional markets is very clear in the above chart. You can see the rate of growth in population in Rest of NSW, Rest of Vic and Rest of WA was stronger in 2024 than it was in 2023 with the slowing of growth in most capital cities has been much greater than it has been in the respective rest of state markets.
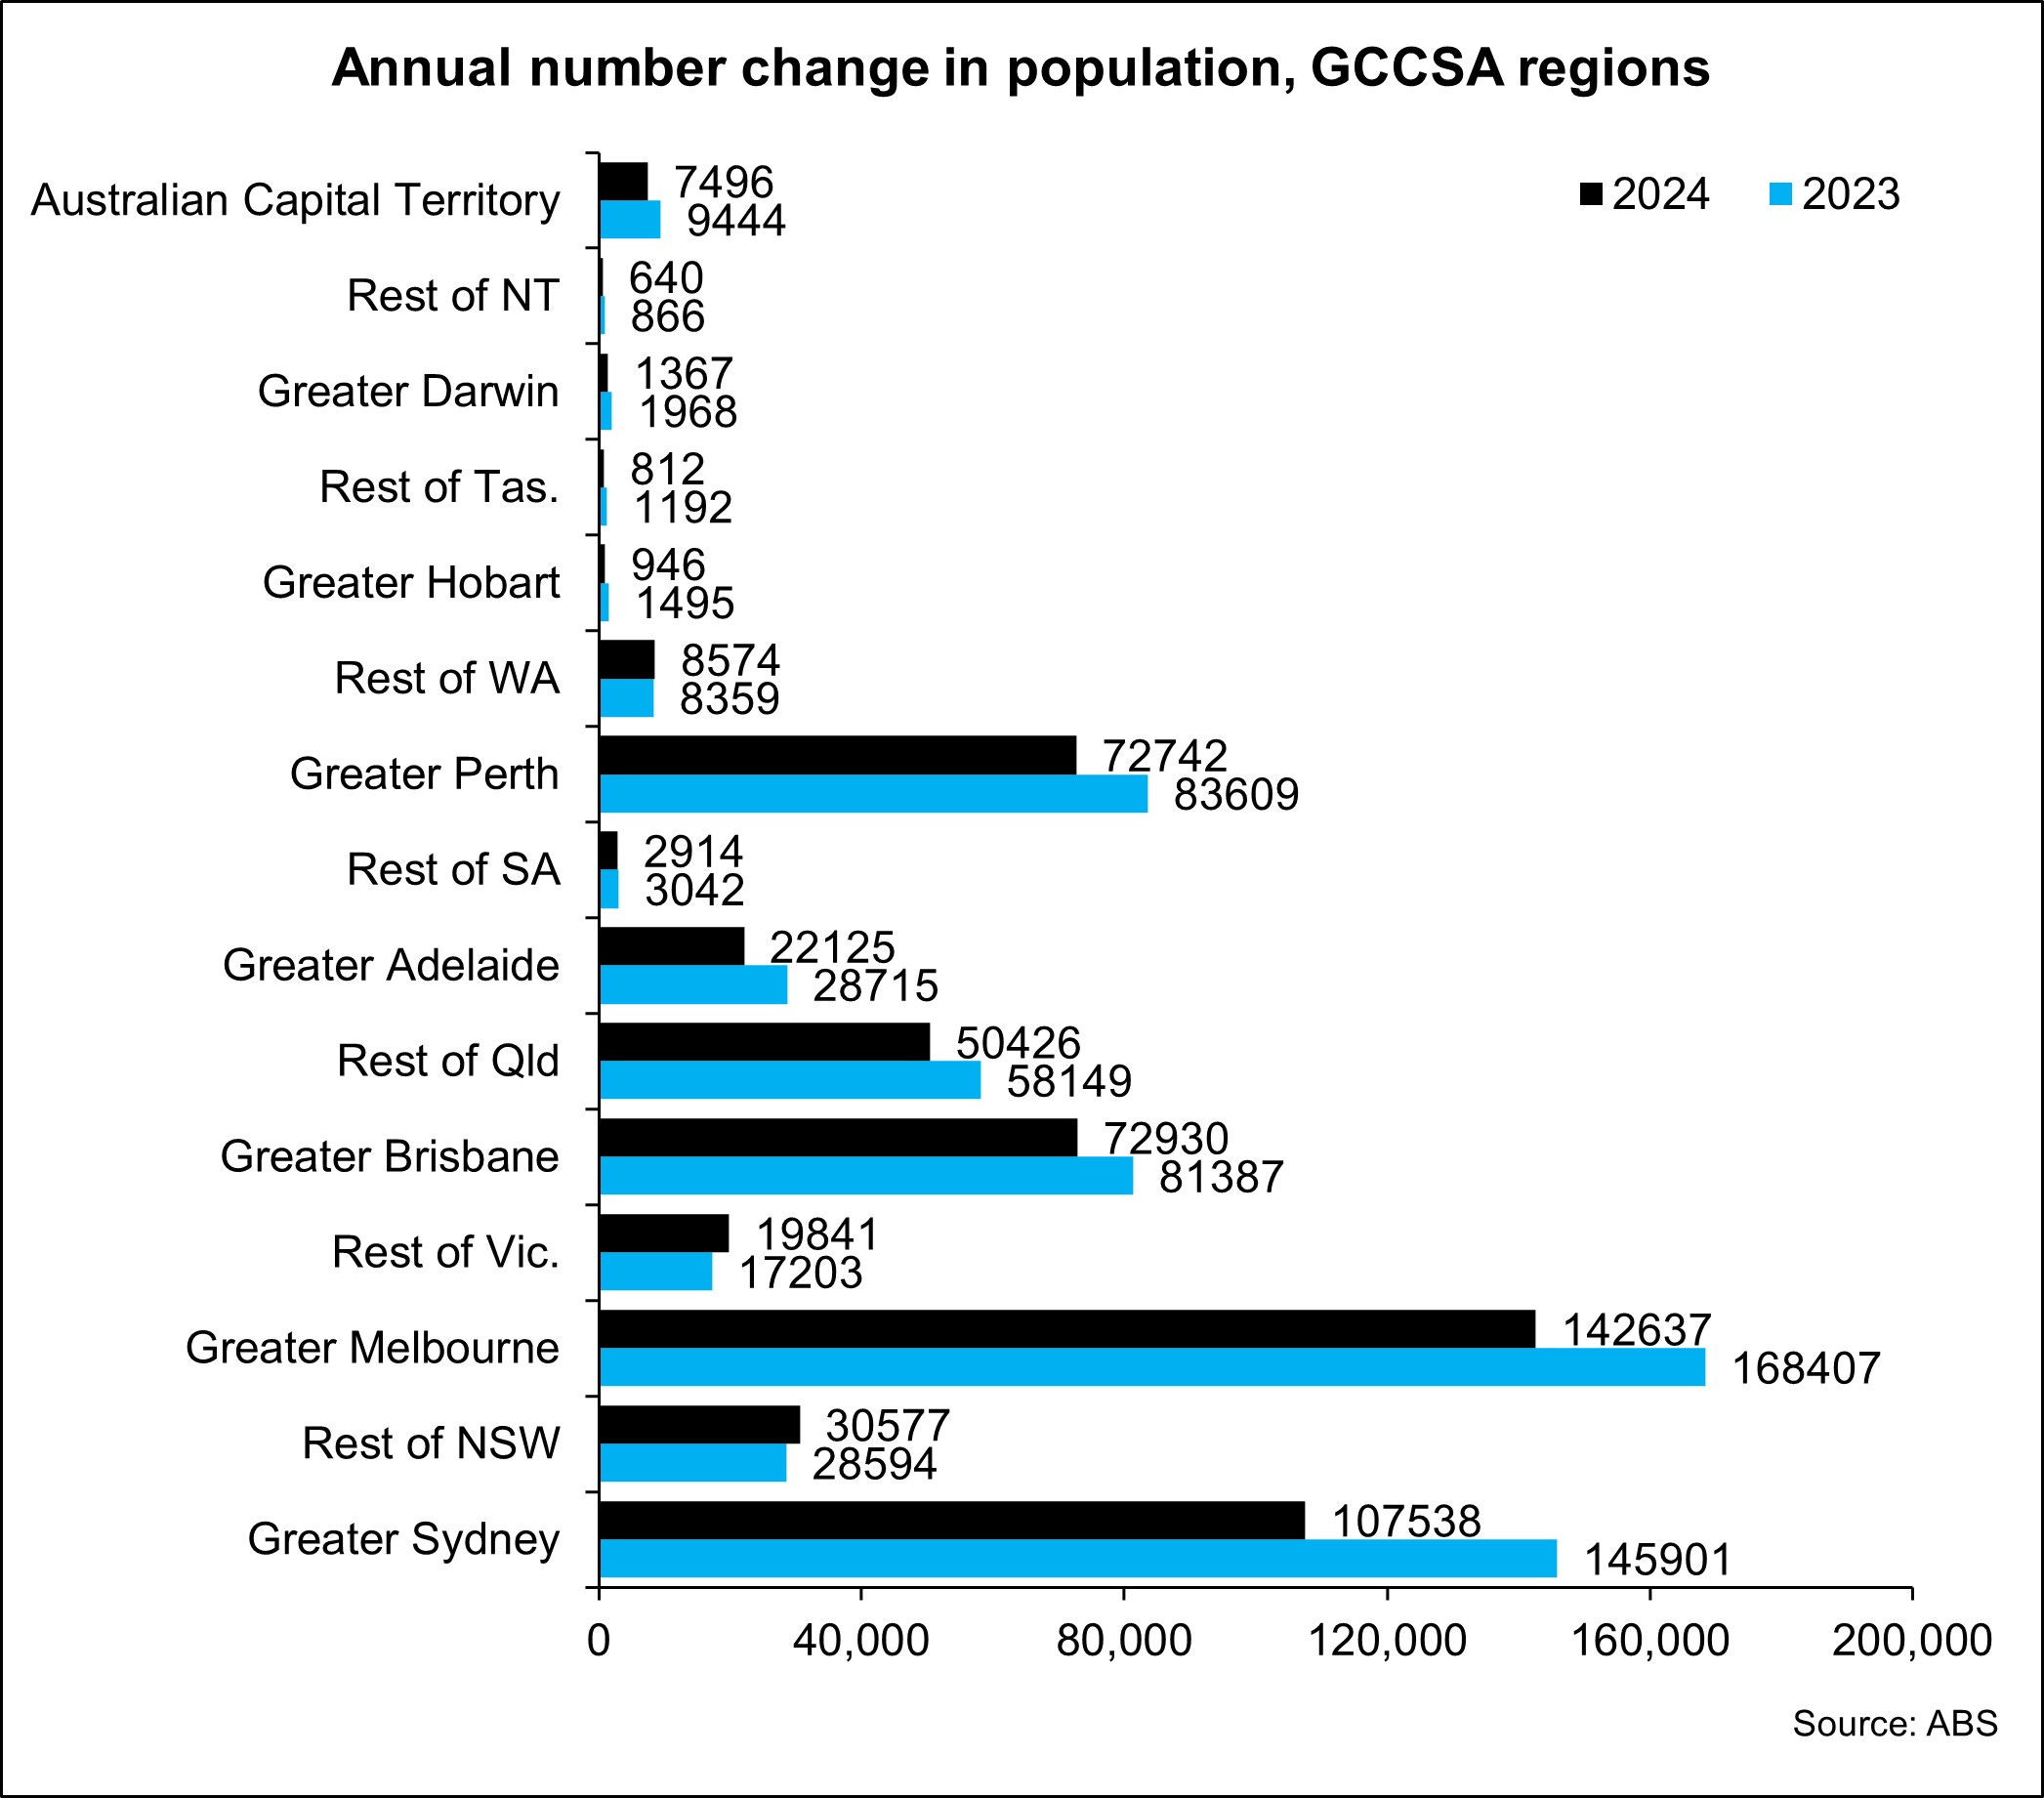
The most populous regions of the county continue to see the largest increases in population, as highlighted by the above.
What’s driving the more dramatic slowing, albeit still higher rate of population growth in the capital cities compared to regional markets? Looking at the components of population growth provides this valuable insight.
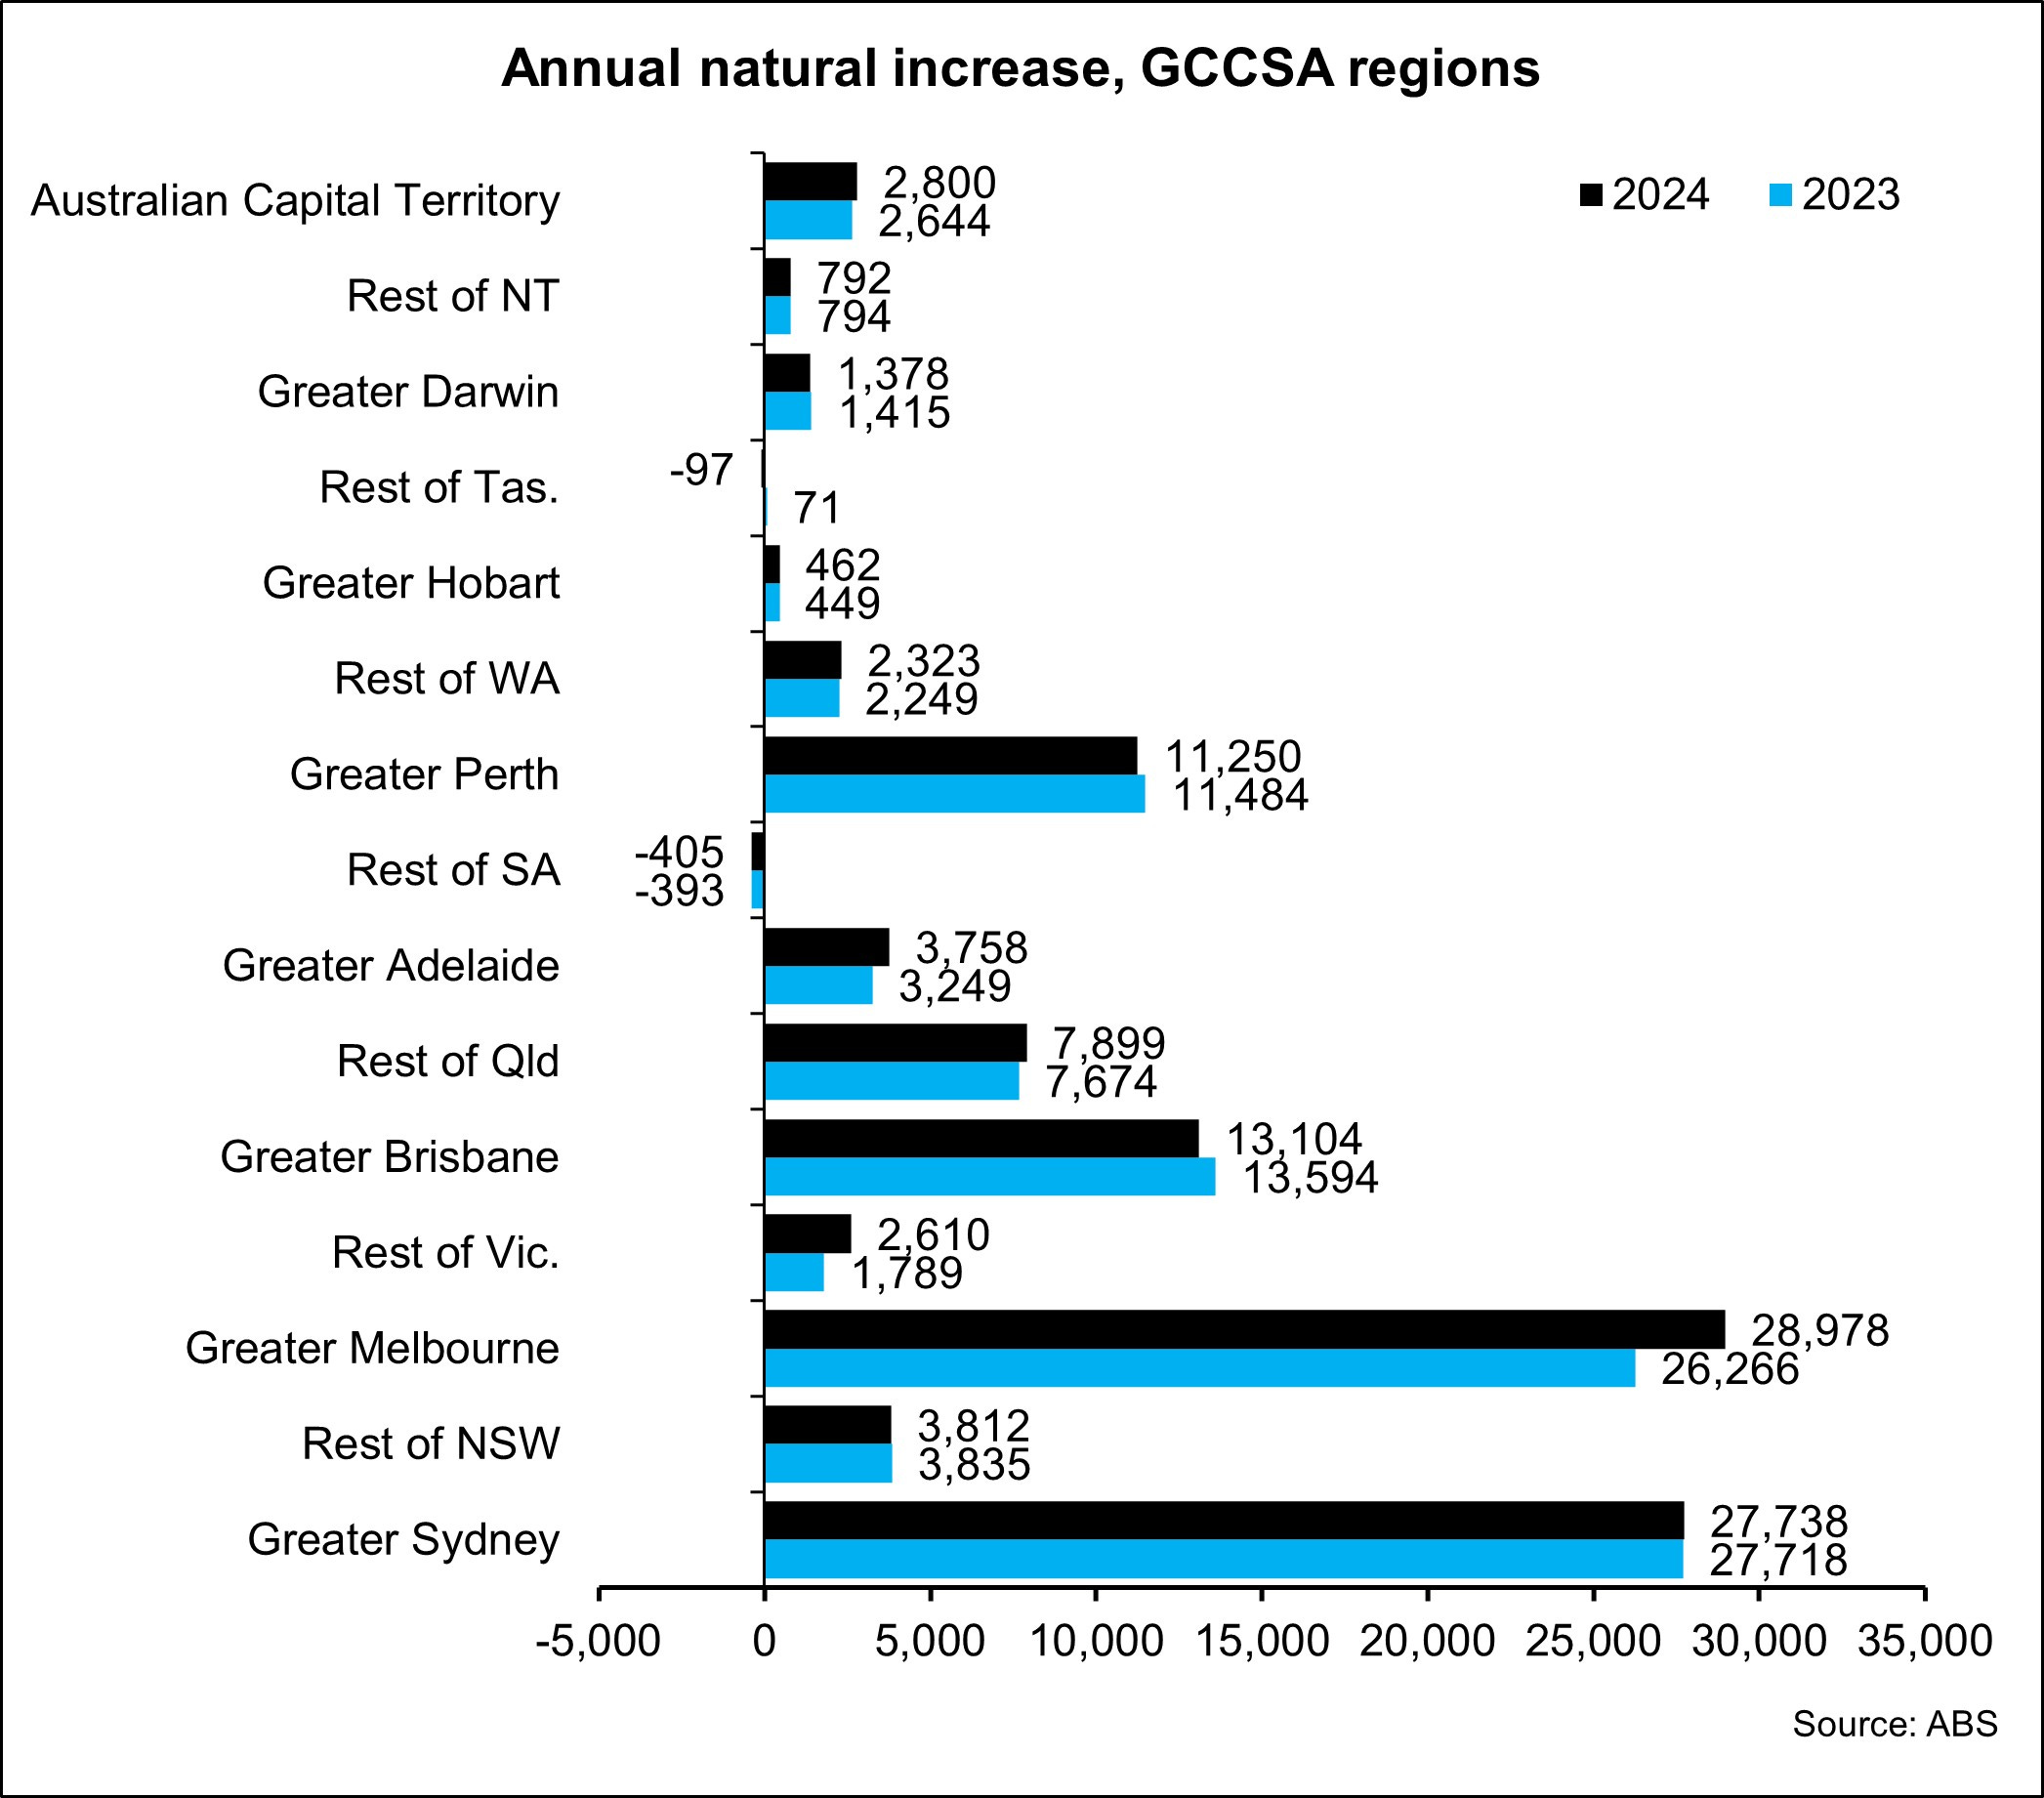
Natural increase measures the difference between the number of births and the number of deaths. With an ageing population and families having fewer children, natural increase has been trending lower for many years. In most regions there is minimal fluctuation year-to-year although there was a relatively large uptick in natural increase in Melbourne between the 2022-23 financial year and the 2023-24 financial year.
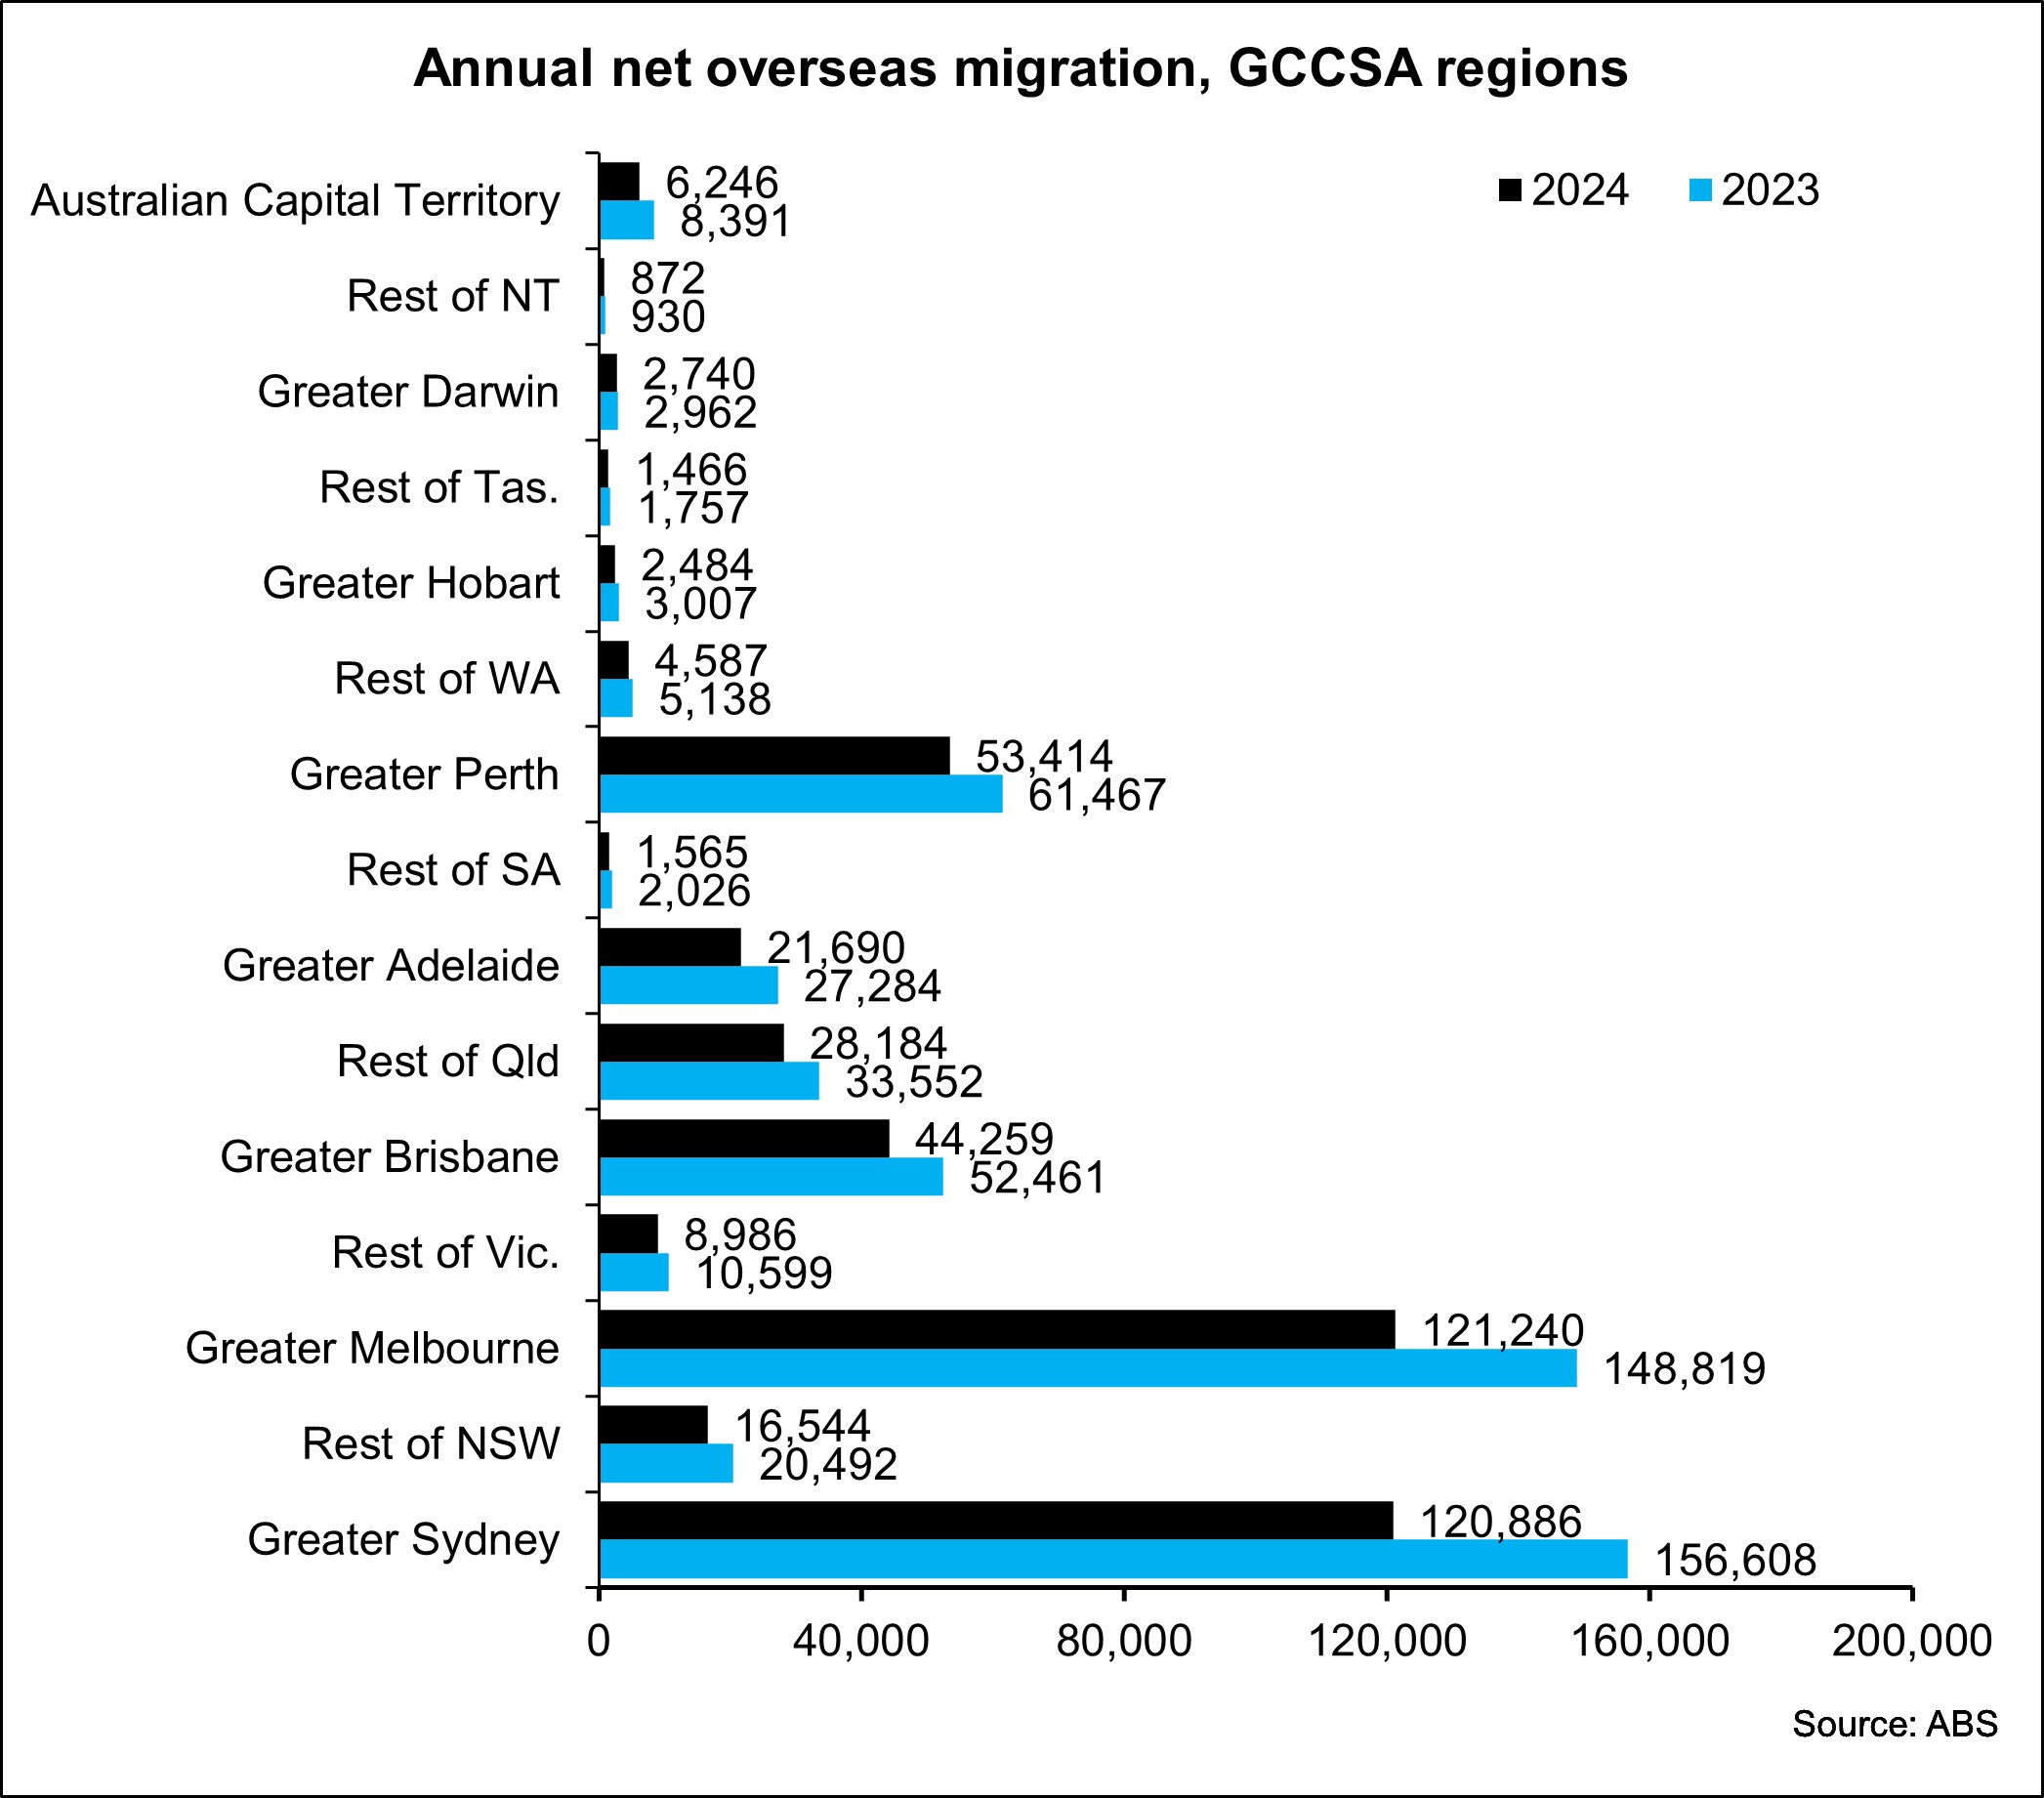
Net overseas migration hit a record high in 2022-23 and although it eased in 2023-24, it remained at an historically very high level. Over the most recent year, 85.7% of all net overseas migration was into a capital city, down from 86.1% the previous year.
The major benefactors of net overseas migration are Sydney and Melbourne accounting for 27.8% and 27.9% of total net overseas migration over the year and then followed by Perth (12.3%), Brisbane (10.2%) and Rest of Qld (6.5%). 55.6% of total net overseas migration is into Sydney and Melbourne with 84.6% occurring in those two cities plus Brisbane, Rest of Qld and Perth.
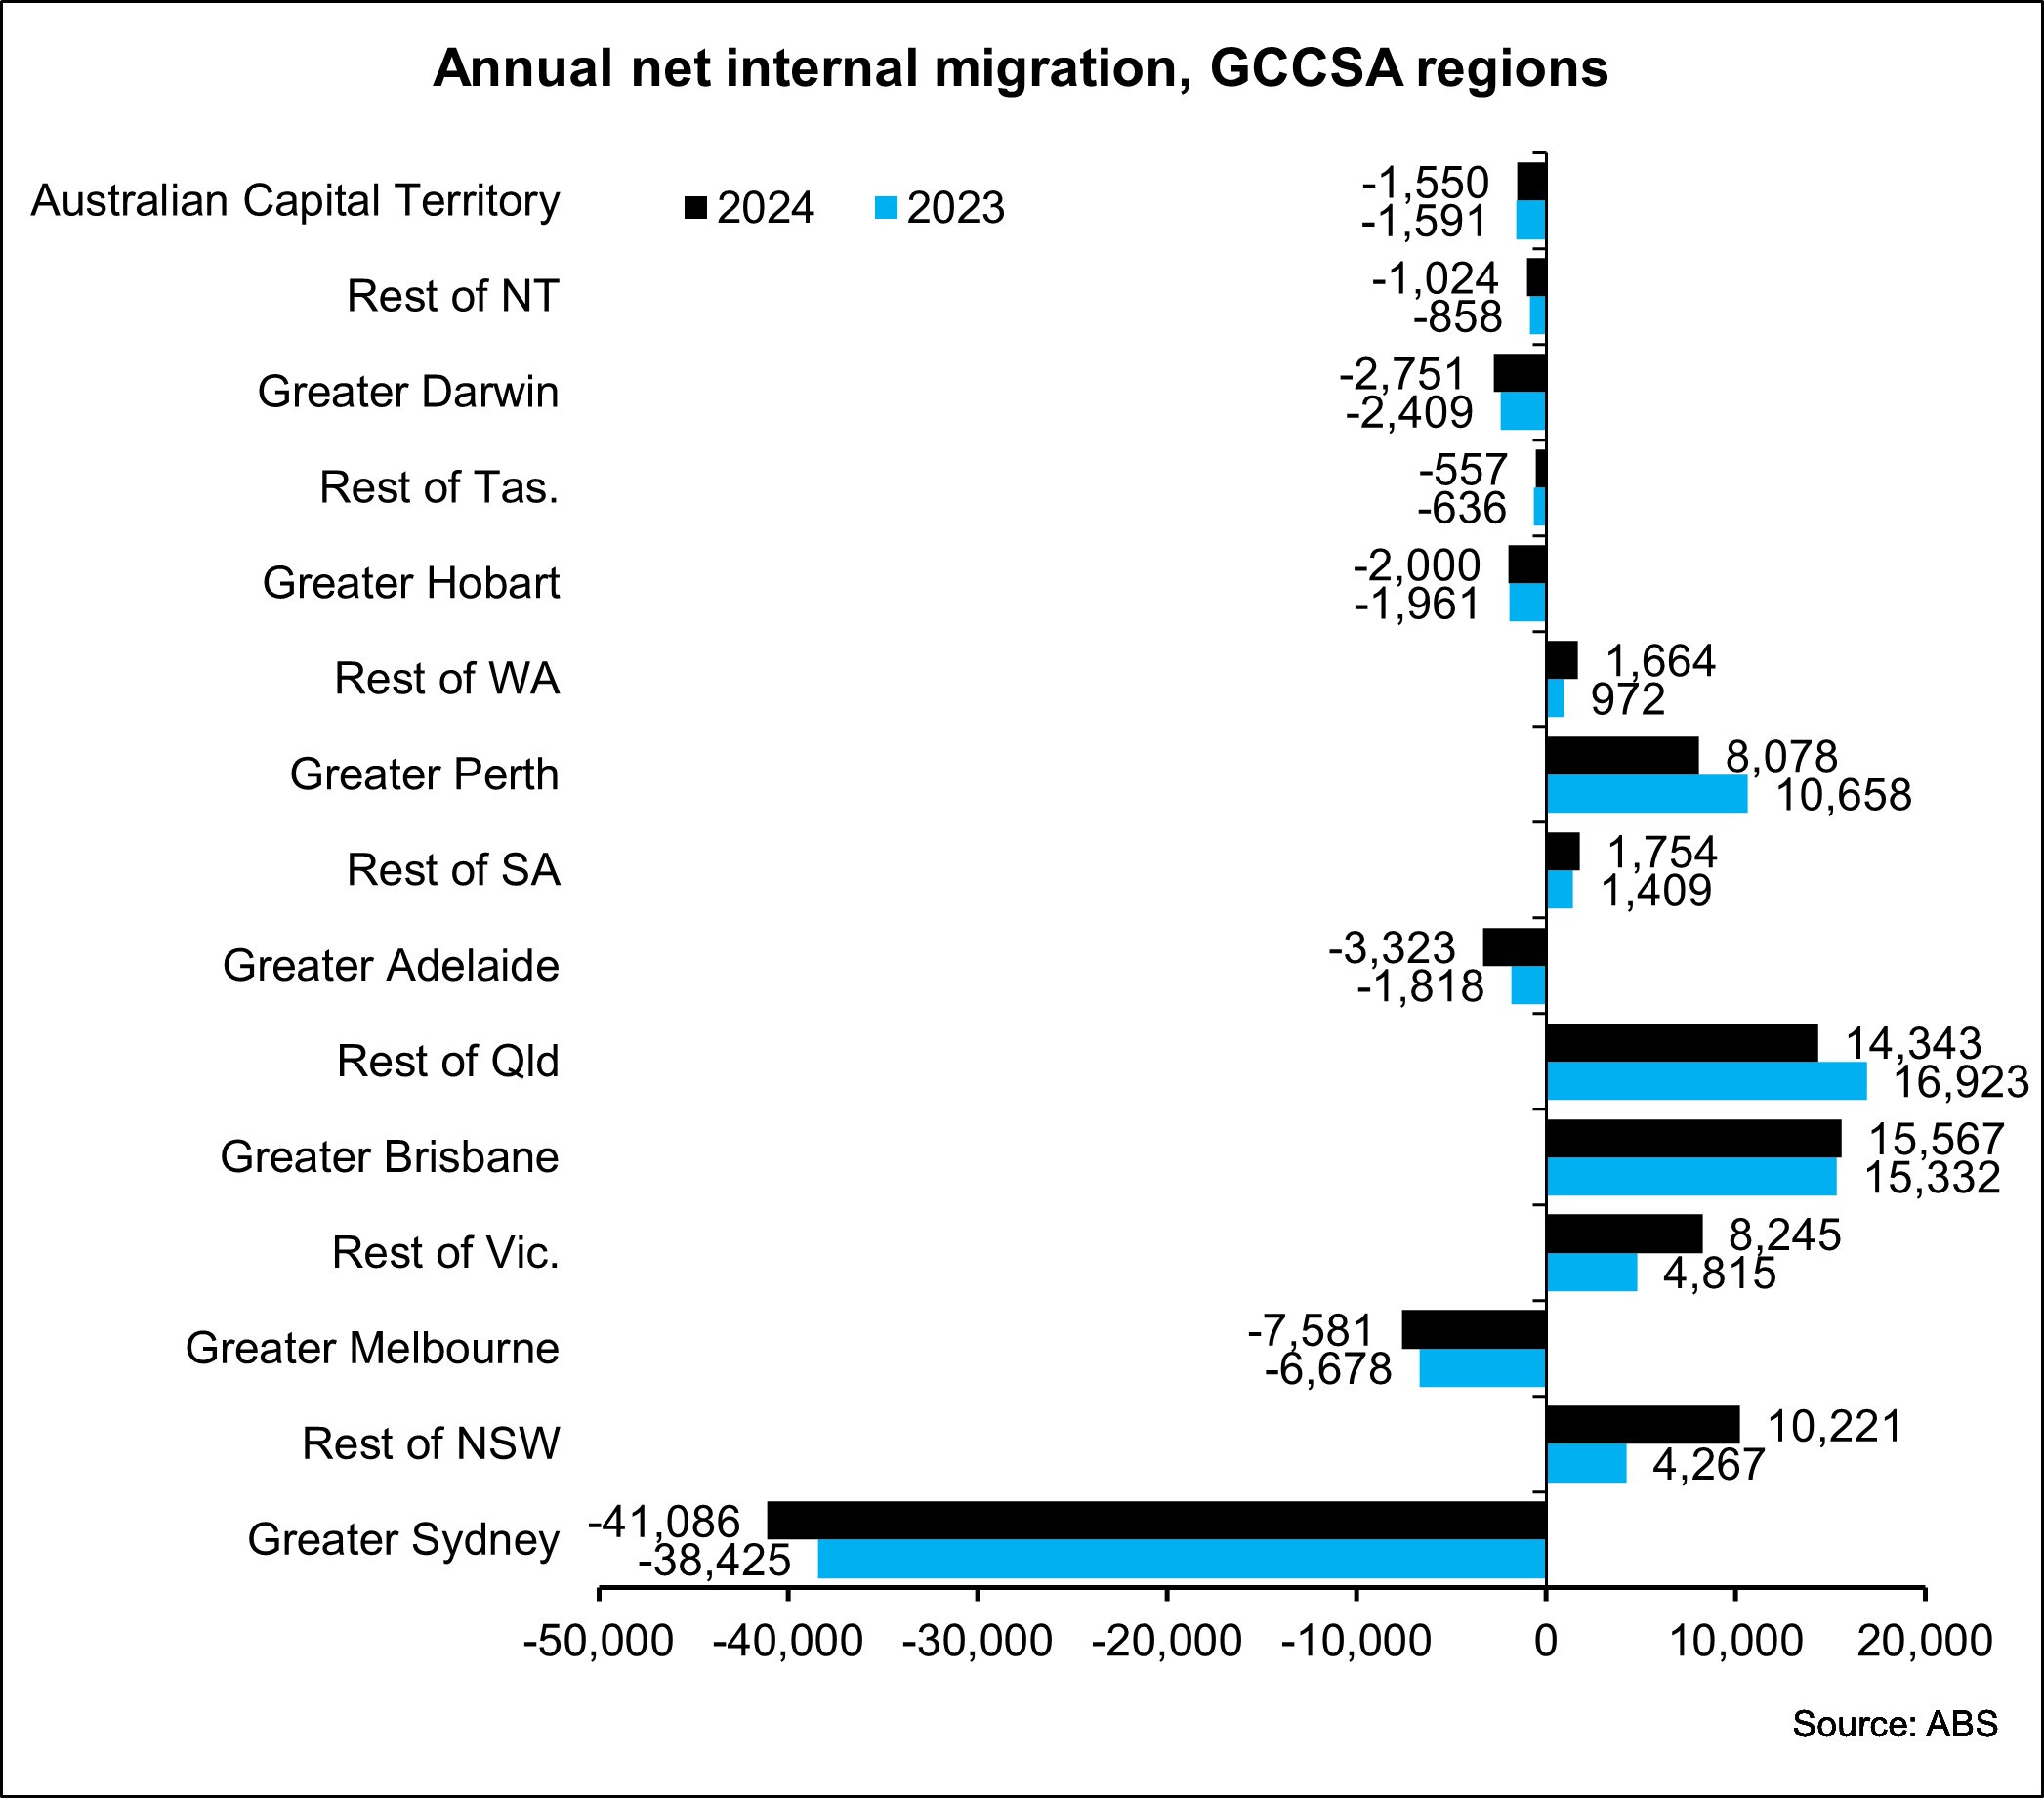
Which brings us to net internal migration which nets out to zero at a national level but the trends are very telling. NSW has seen a large loss from net internal migration for decades but as you can see here, it is completely due to Sydney. Vic’s net internal migration was slightly positive over the year but that was due to more people migrating to Rest of Vic than those leaving Melbourne, probably a case of a lot of people in Melbourne shifting to regional Vic. Qld and WA were the only two states in which net internal migration was positive in both the capital city and the rest of state area.
It’s informative to look at net internal migration trends more closely across each state over a longer timeframe.
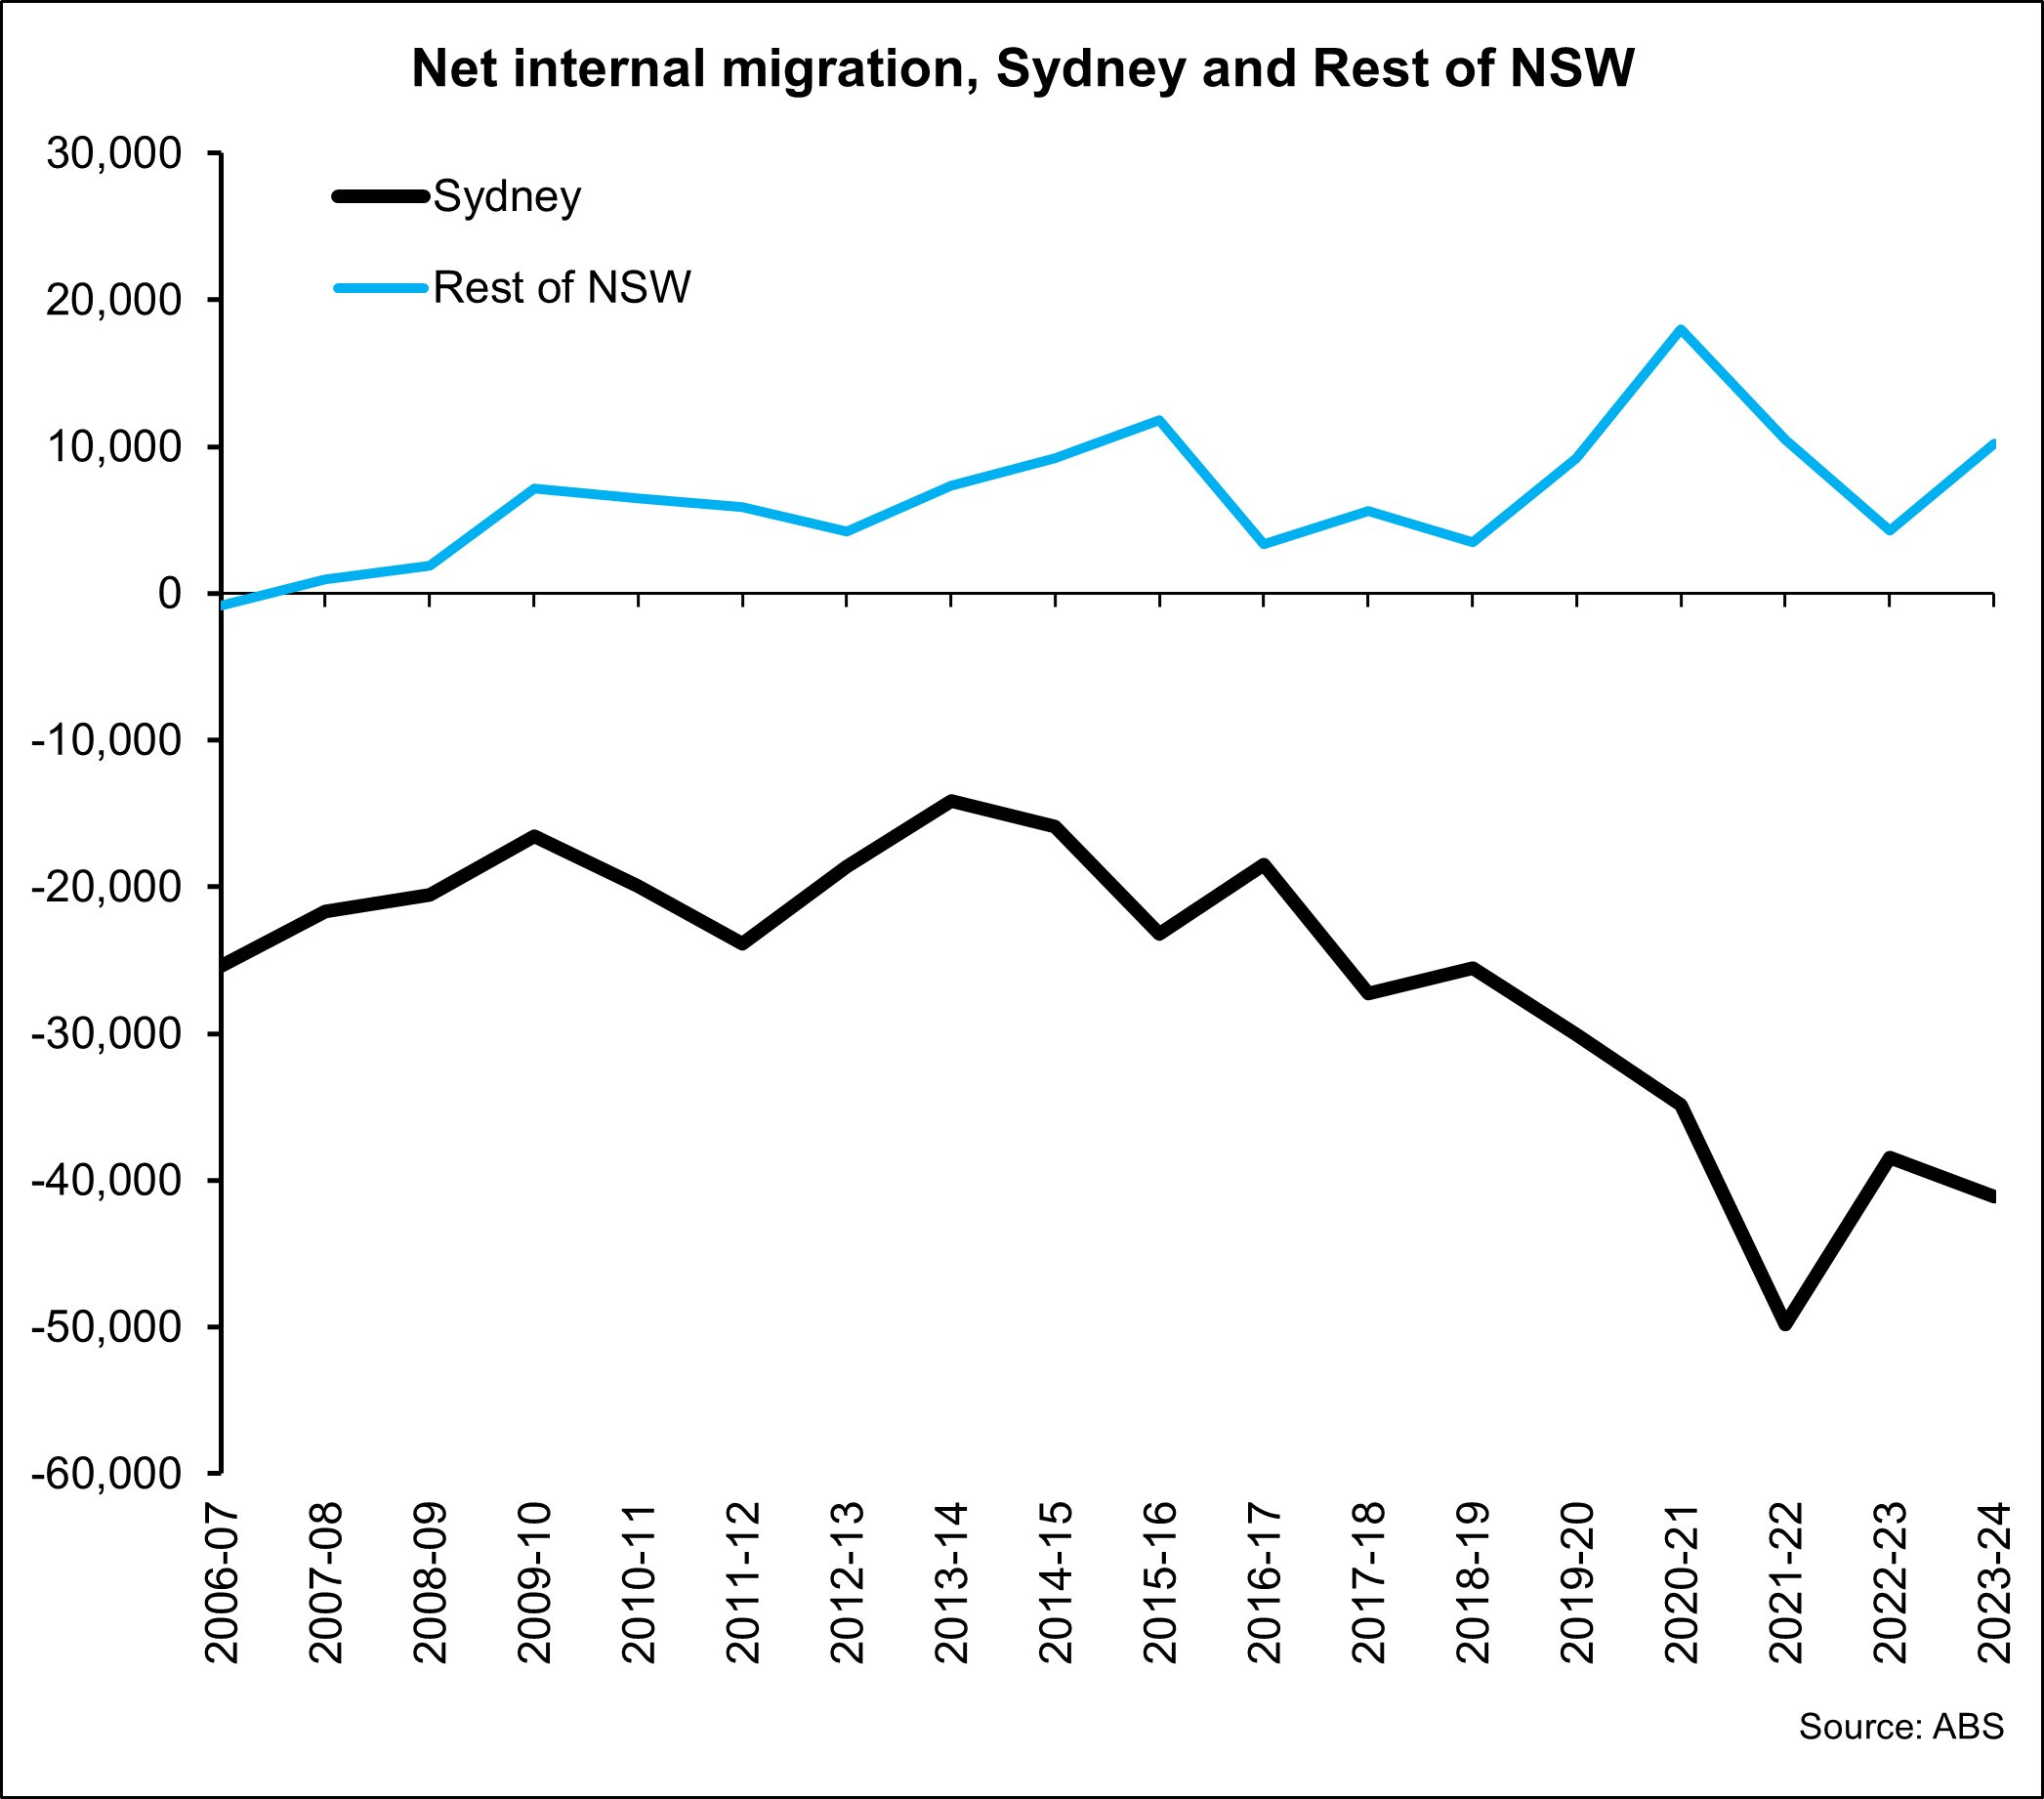
The ABS has published net internal migration at a state level quarterly since 1981 and over that time, NSW has never once had positive net internal migration. Looking at the chart above it is interesting to note that net internal migration away from Sydney is trending toward a larger volume however, relatively few of those leaving Sydney appear to be migrating to other parts of NSW, albeit net internal migration to regional NSW is positive. Each year since 2021-22 the volume of people migrating away from Sydney has been greater than natural increase in Sydney. Although Sydney’s population growth is still significant, it is being driven by net overseas migration at a time when natural increase is low and a lot of Sydney residents are moving out of the city.
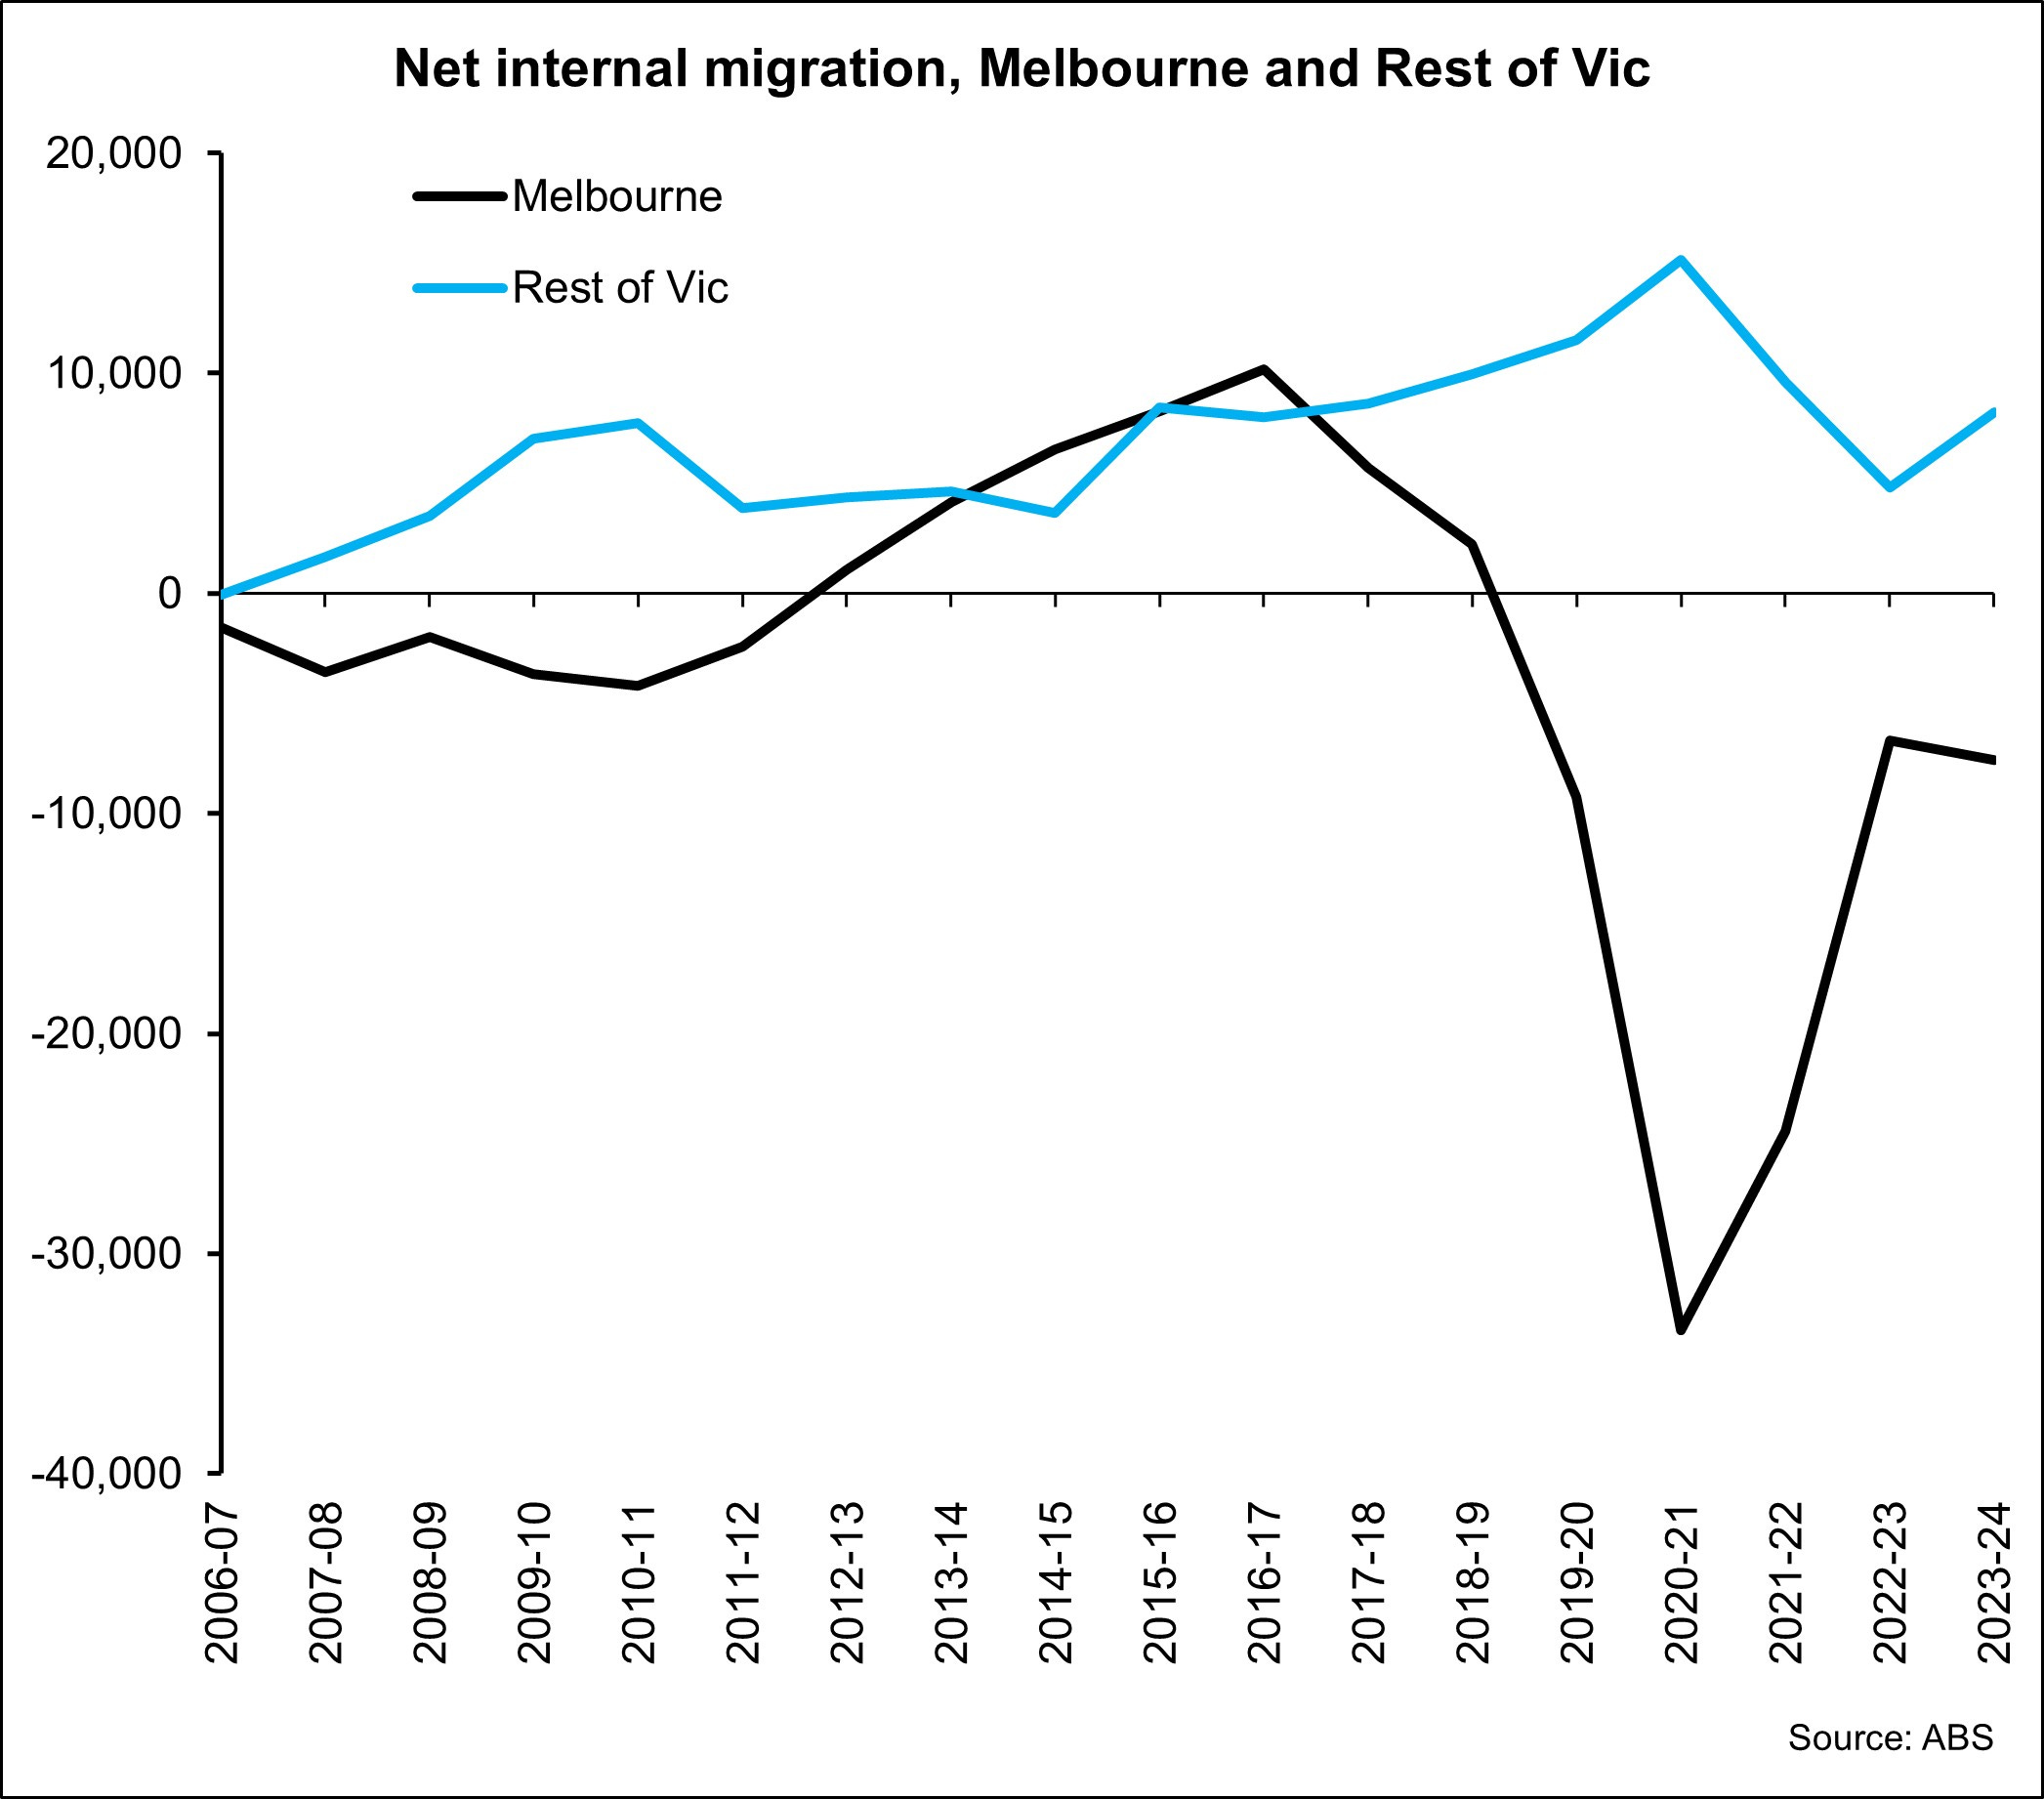
Net internal migration to Rest of Vic has been positive every year since 2007-08 while Melbourne is much more variable. Over recent years lockdowns clearly adversely impacted on migration to the capital city however, as of 2023-24 Melbourne still lost 7,581 more residents than it gained. With housing prices becoming increasingly affordable relative to other capital cities this will probably improve over the coming years but the dire state of the public finances will potentially continue to see current residents choosing to leave the city and state.
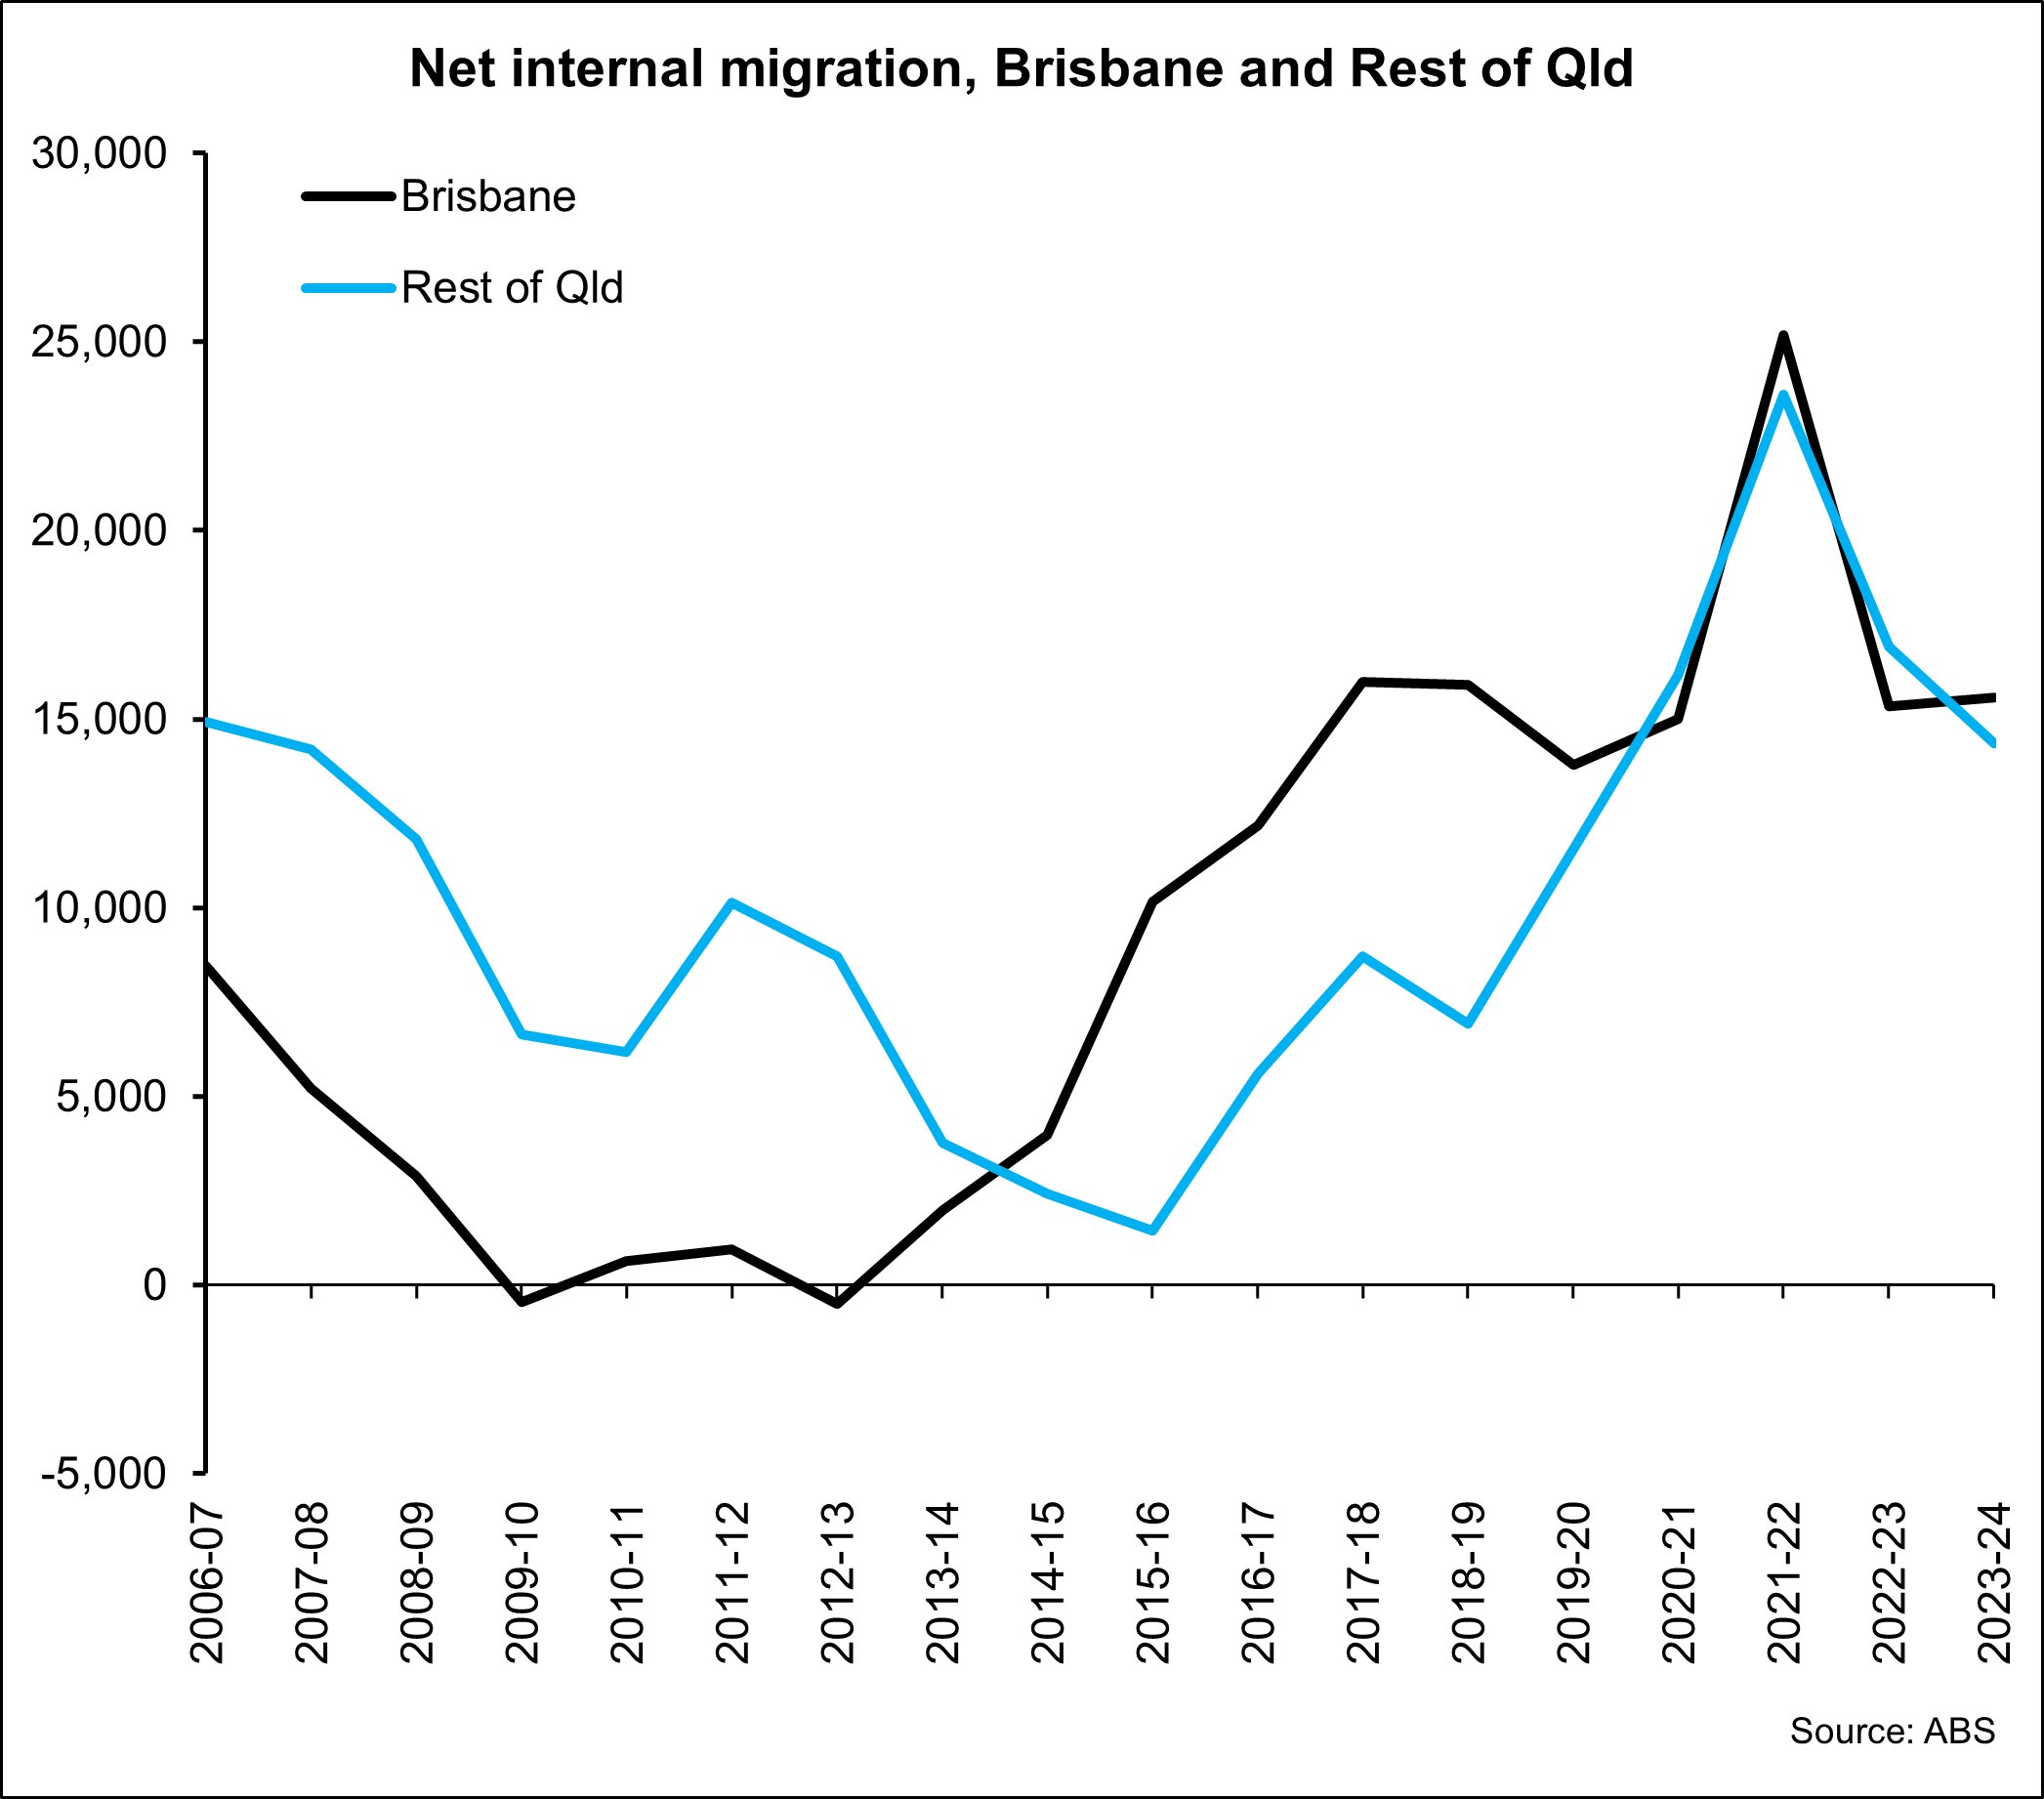
Qld has consistently been the epicentre of net internal migration. Each year from 2006-07 onwards, net internal migration to the Rest of Qld region has been positive and it has been positive to Brisbane each year except for 2009-10 and 2012-13. While net internal migration to Qld has slowed a little, it remains elevated. With the cost of housing in South East Queensland now more expensive than most other parts of the country except for NSW and ACT regions, it will be interesting to see if the rate of internal migration slows or if people migrating to Qld start choosing to shift to other more affordable parts of the state.
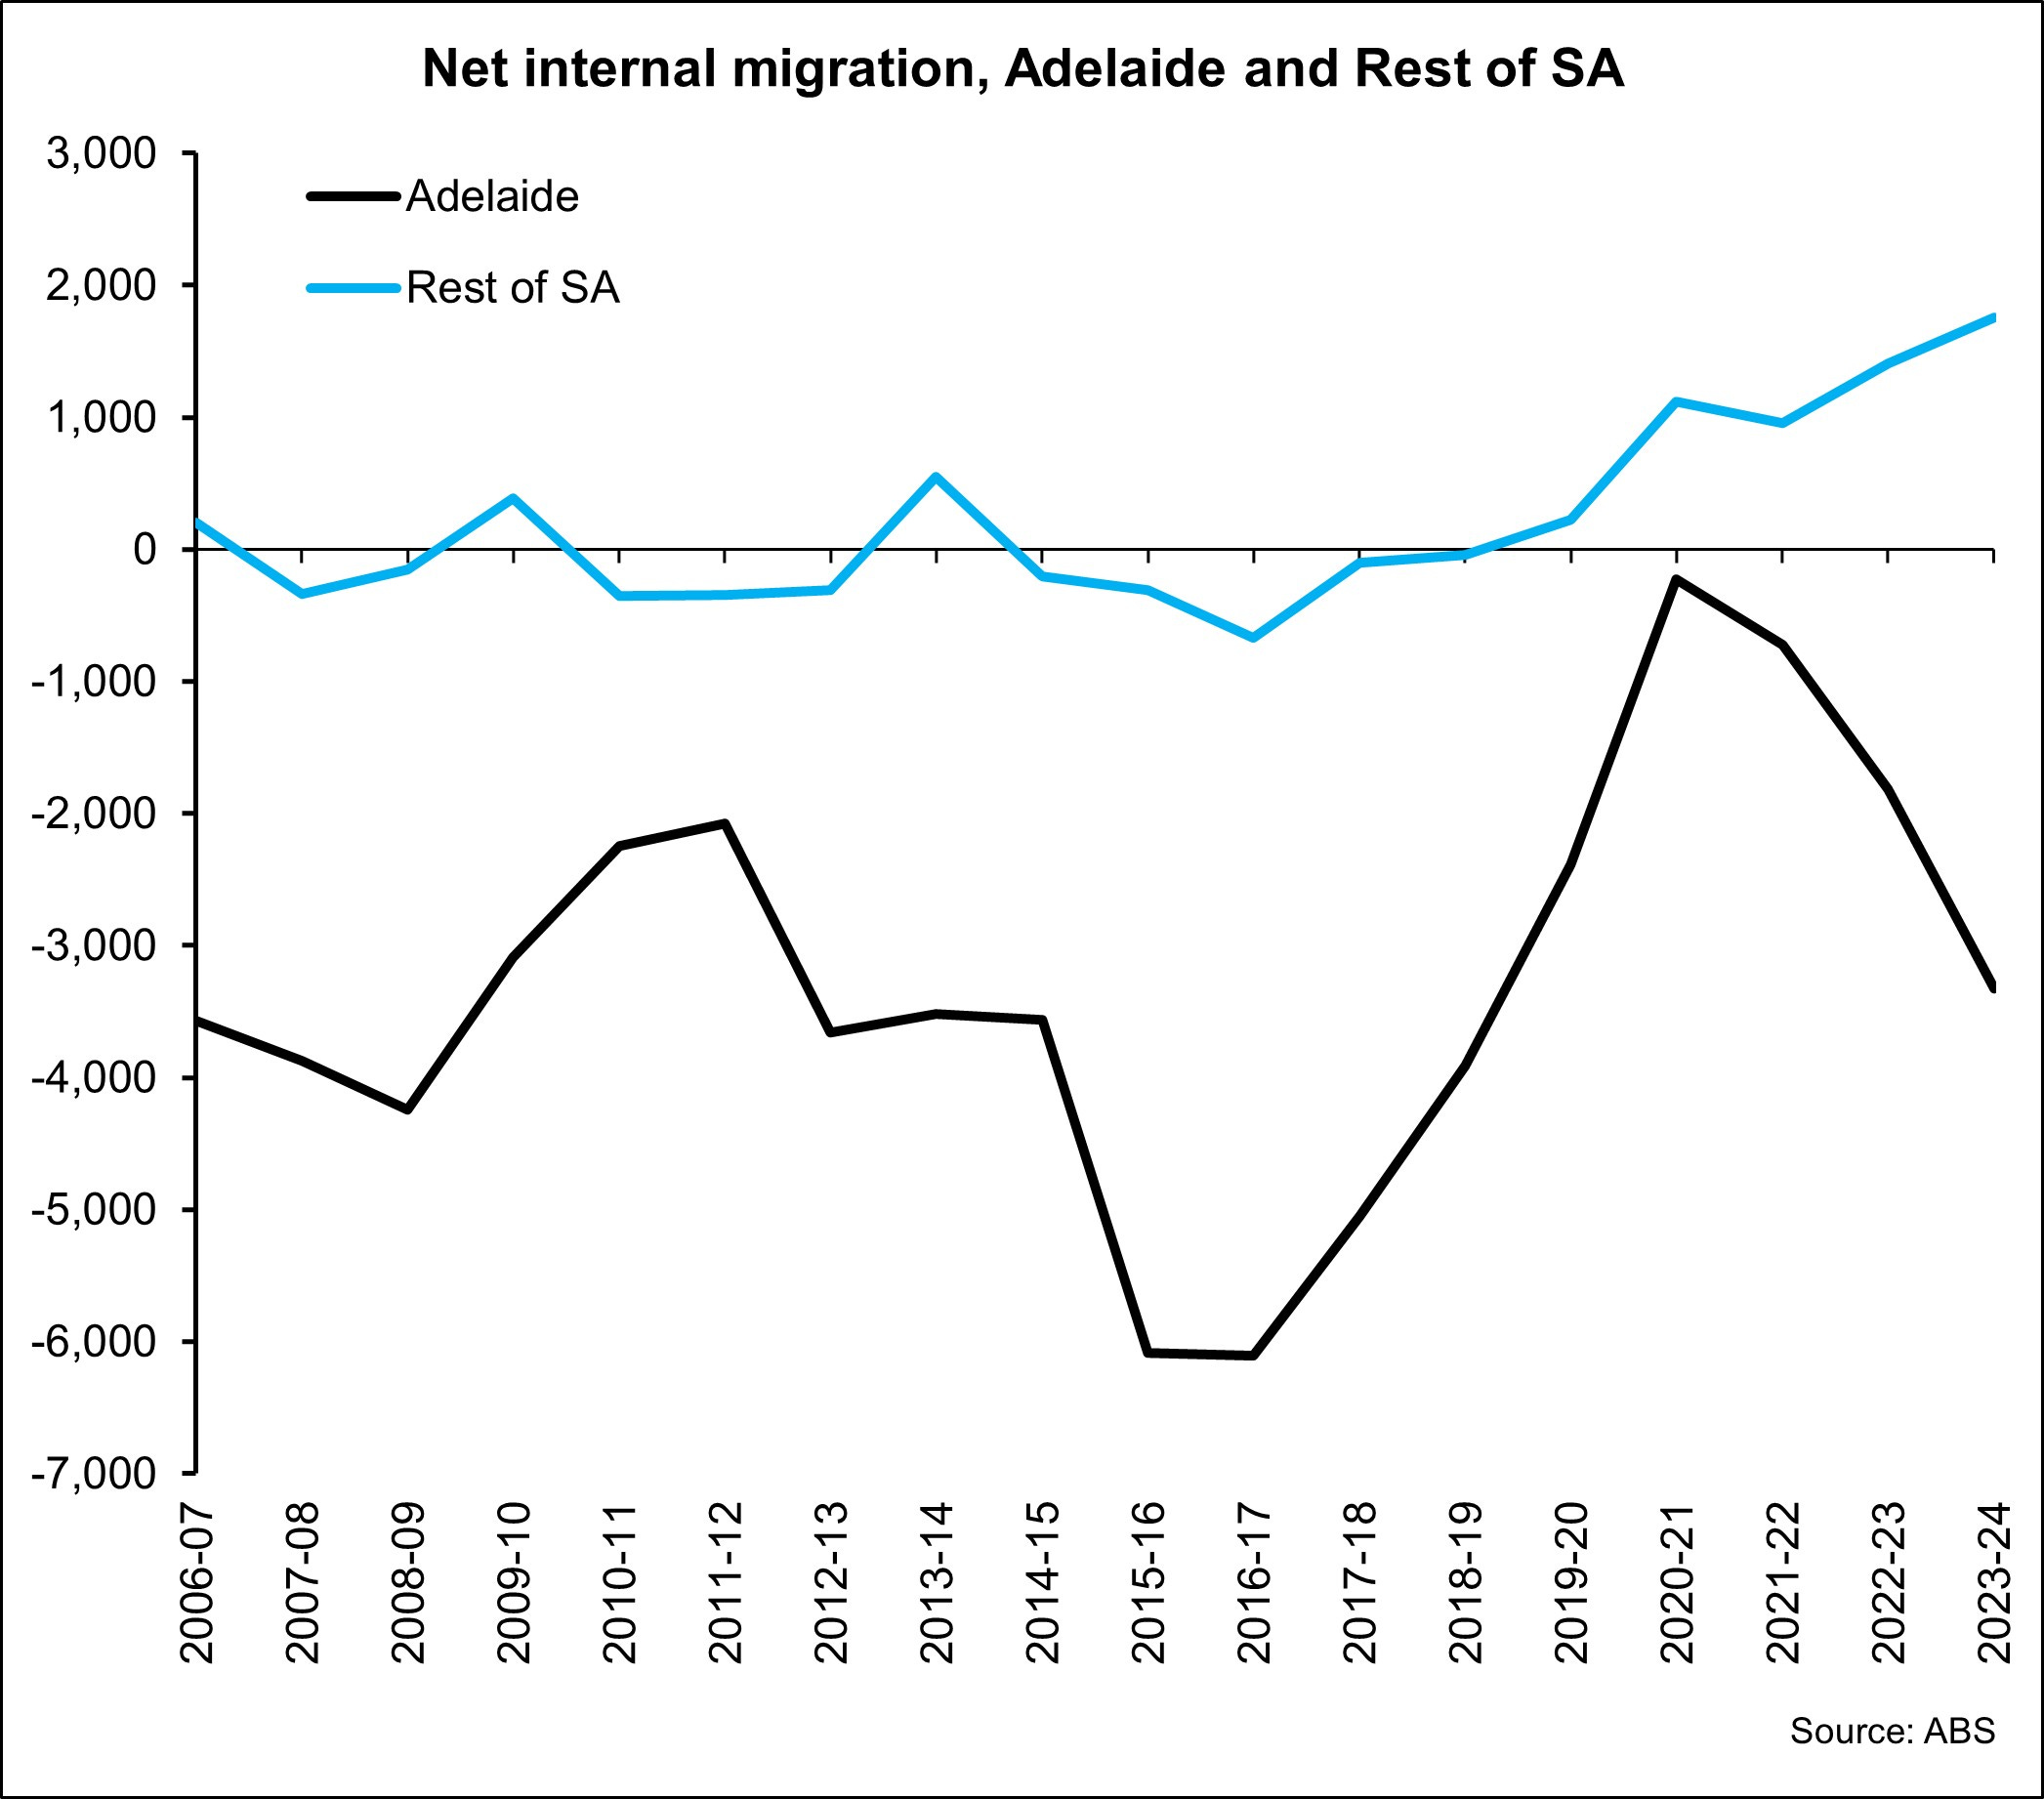
Over each year since 2006-07, Adelaide has lost more residents to other parts of the country than it has gained. Over more recent years, those areas of SA outside of Adelaide have started to seen net internal migration trending higher.
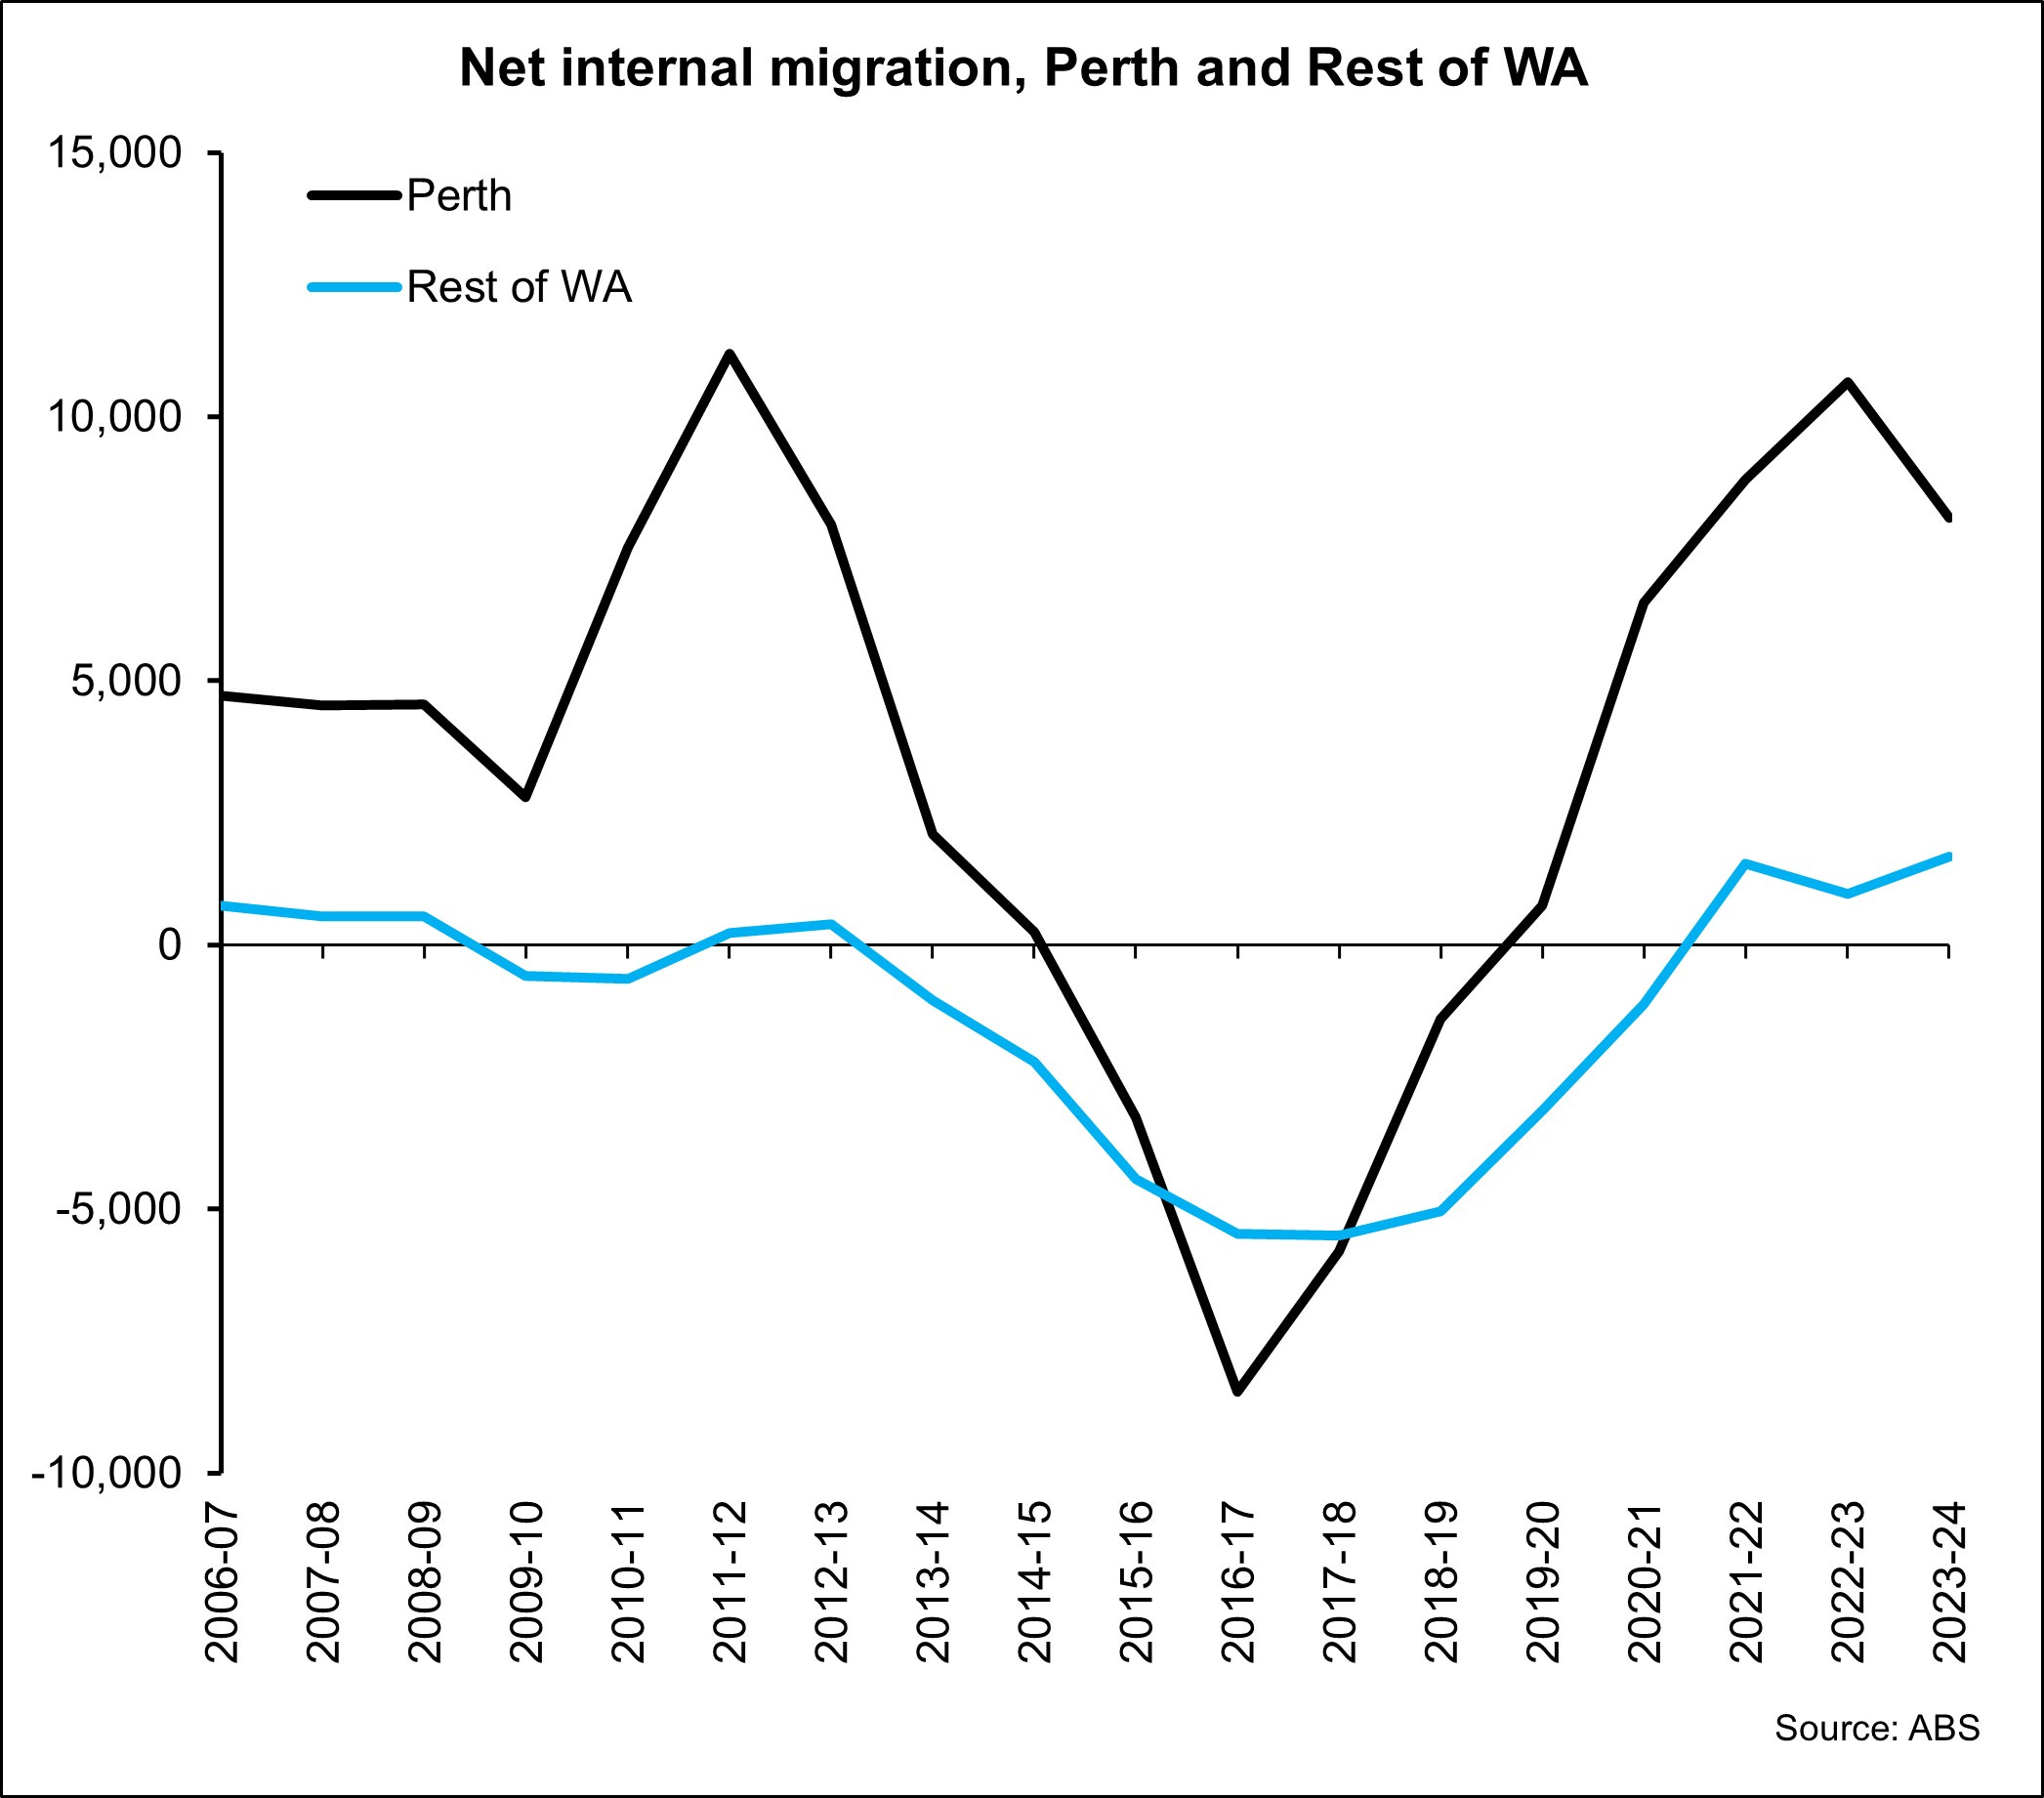
WA like Qld is a state where net internal migration is positive and it is positive both in the capital city (Perth) and in the regional market. Since the onset of the pandemic there has been a significant uplift in net internal migration to WA after it had been negative, and substantially so, in the preceding years. Despite its isolation, the strong economy and relative affordability of housing, which is now not so relatively affordable, have been strong lures attracting people to the state from other areas of the country.
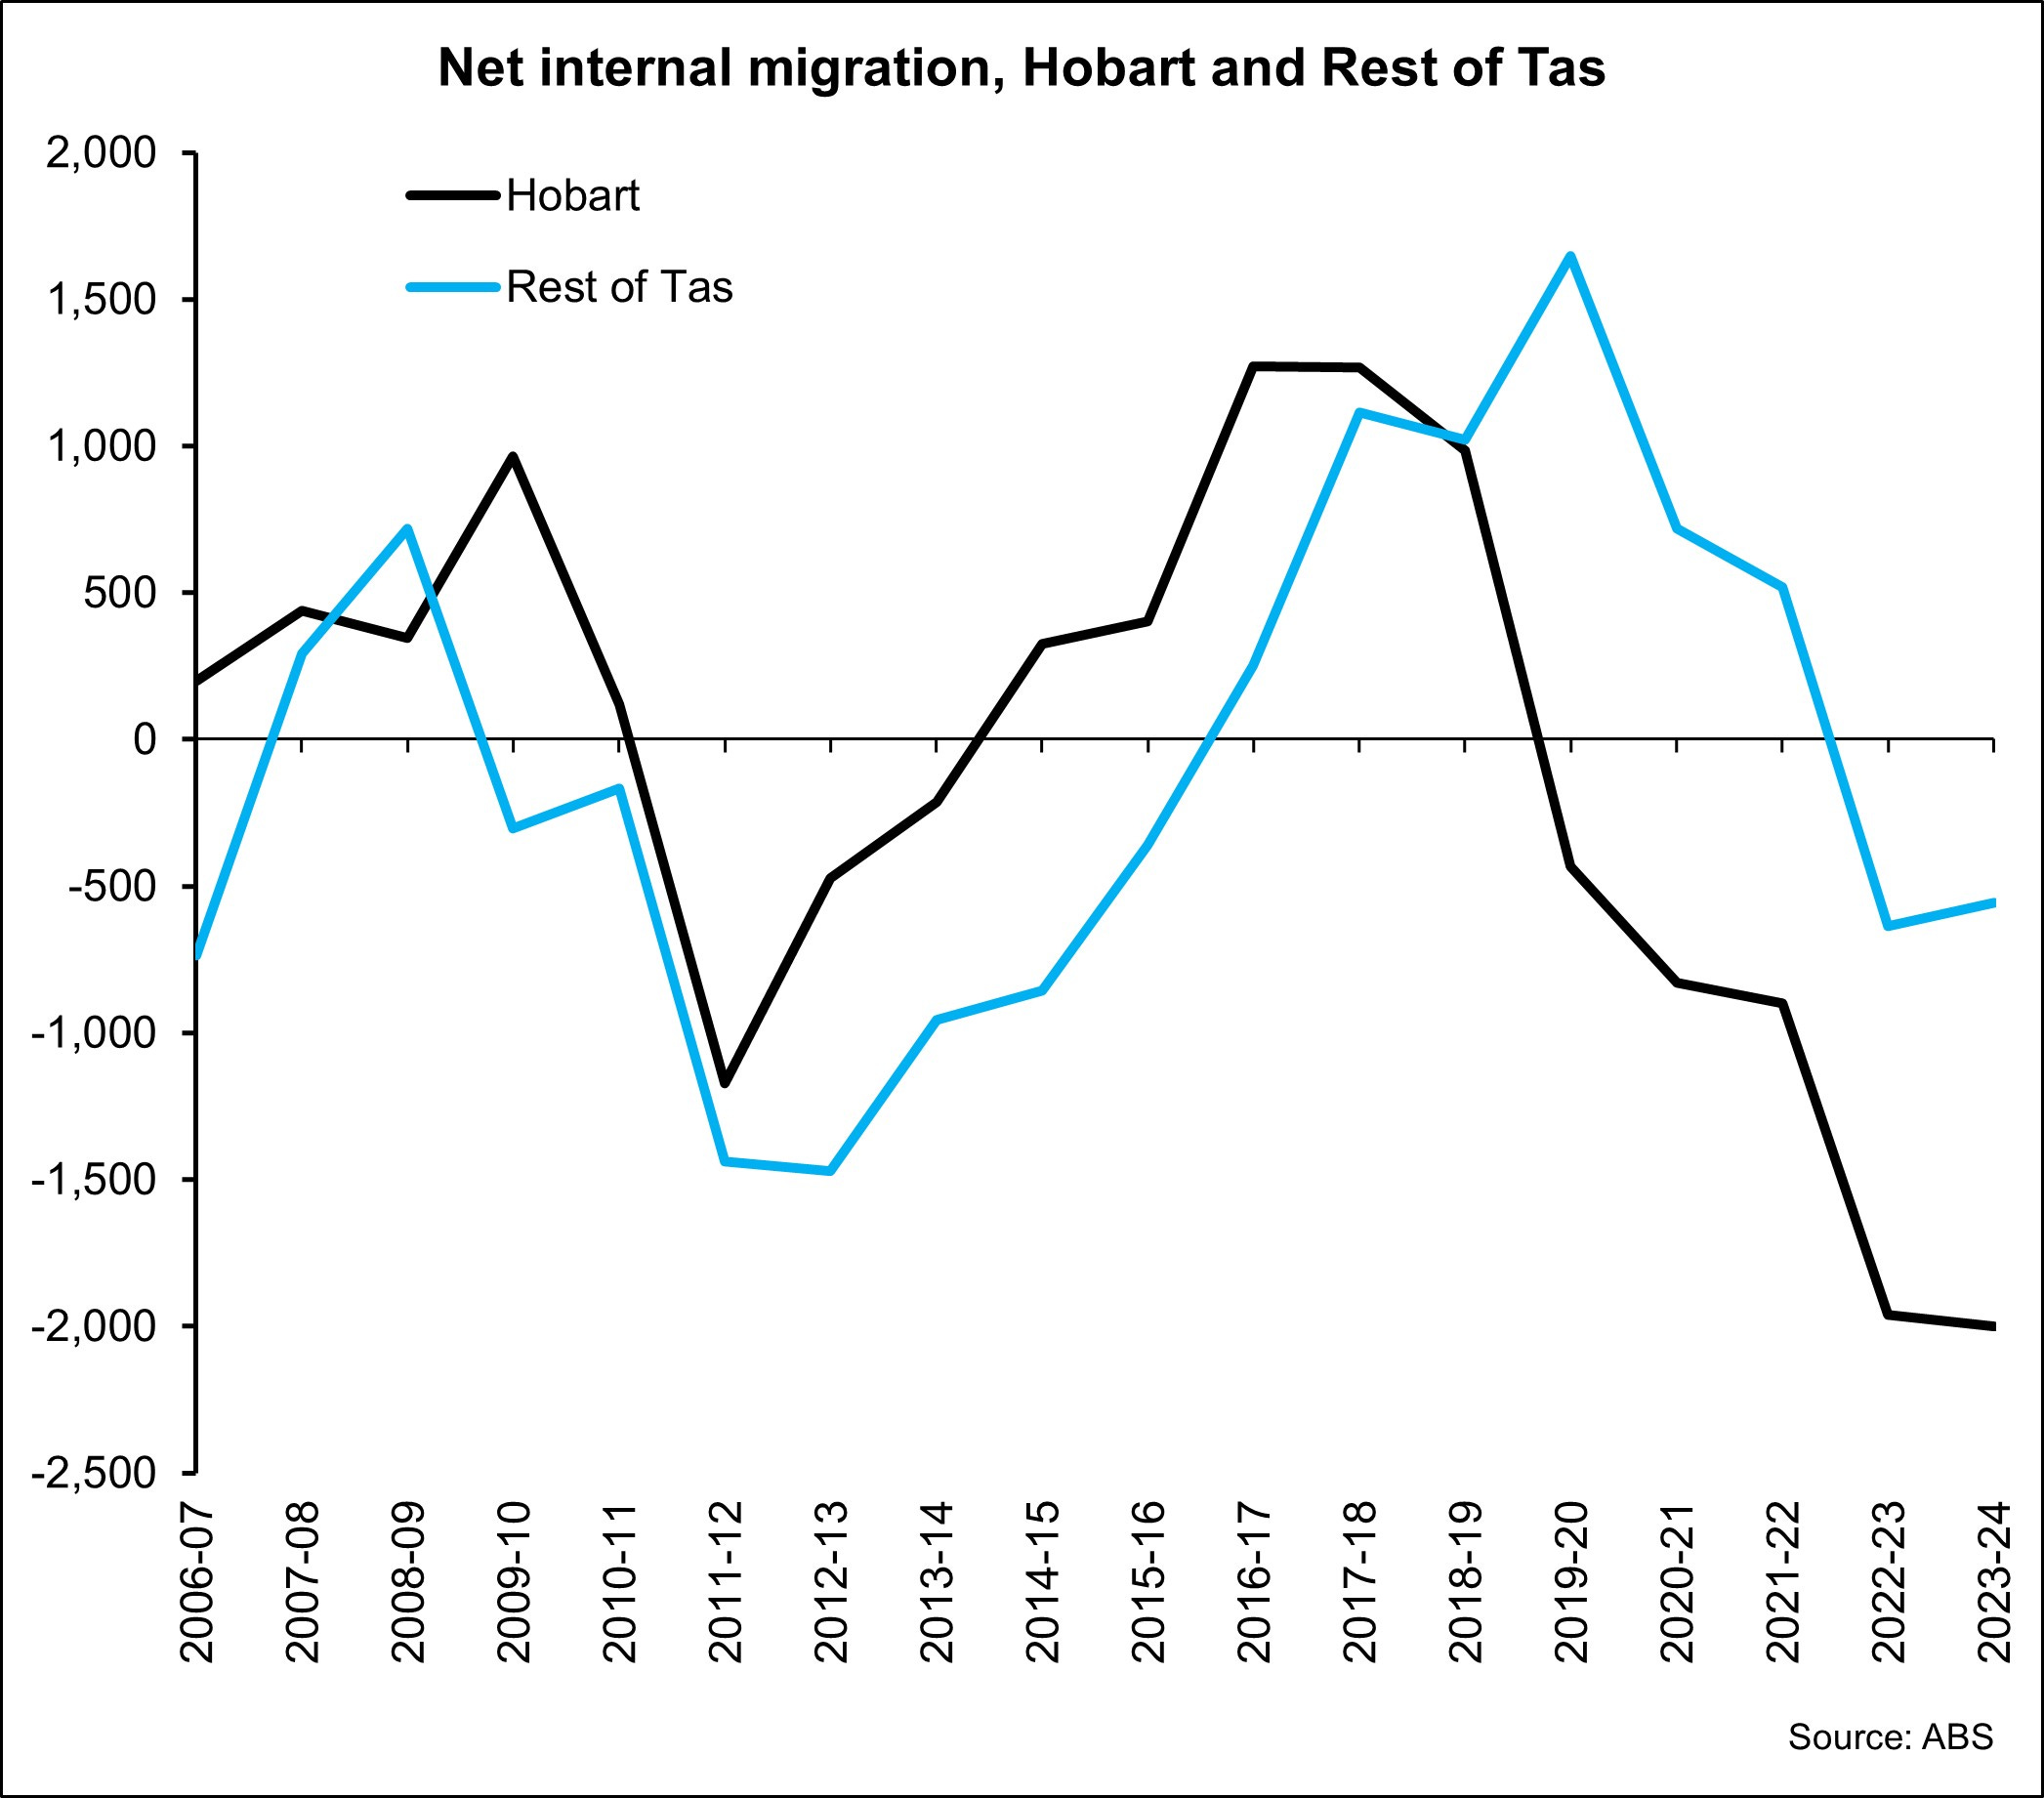
Net internal migration to Tas tends to be not overly negative or positive but it is quite susceptible to fluctuations as you can see above. Over the past few years there has been a fairly sharp fall in net interstate migration to Tas. A big driver of the lift in migration to Tas was the relative affordability of housing and the desire to move away from the big cities which predated the pandemic. Through the pandemic, Hobart in particular has lost more people than it has gained. Hobart and Tas as a whole are now seeing housing prices which are quite affordable relative to other areas of the country so we may see an upswing in net internal migration again over the coming years.
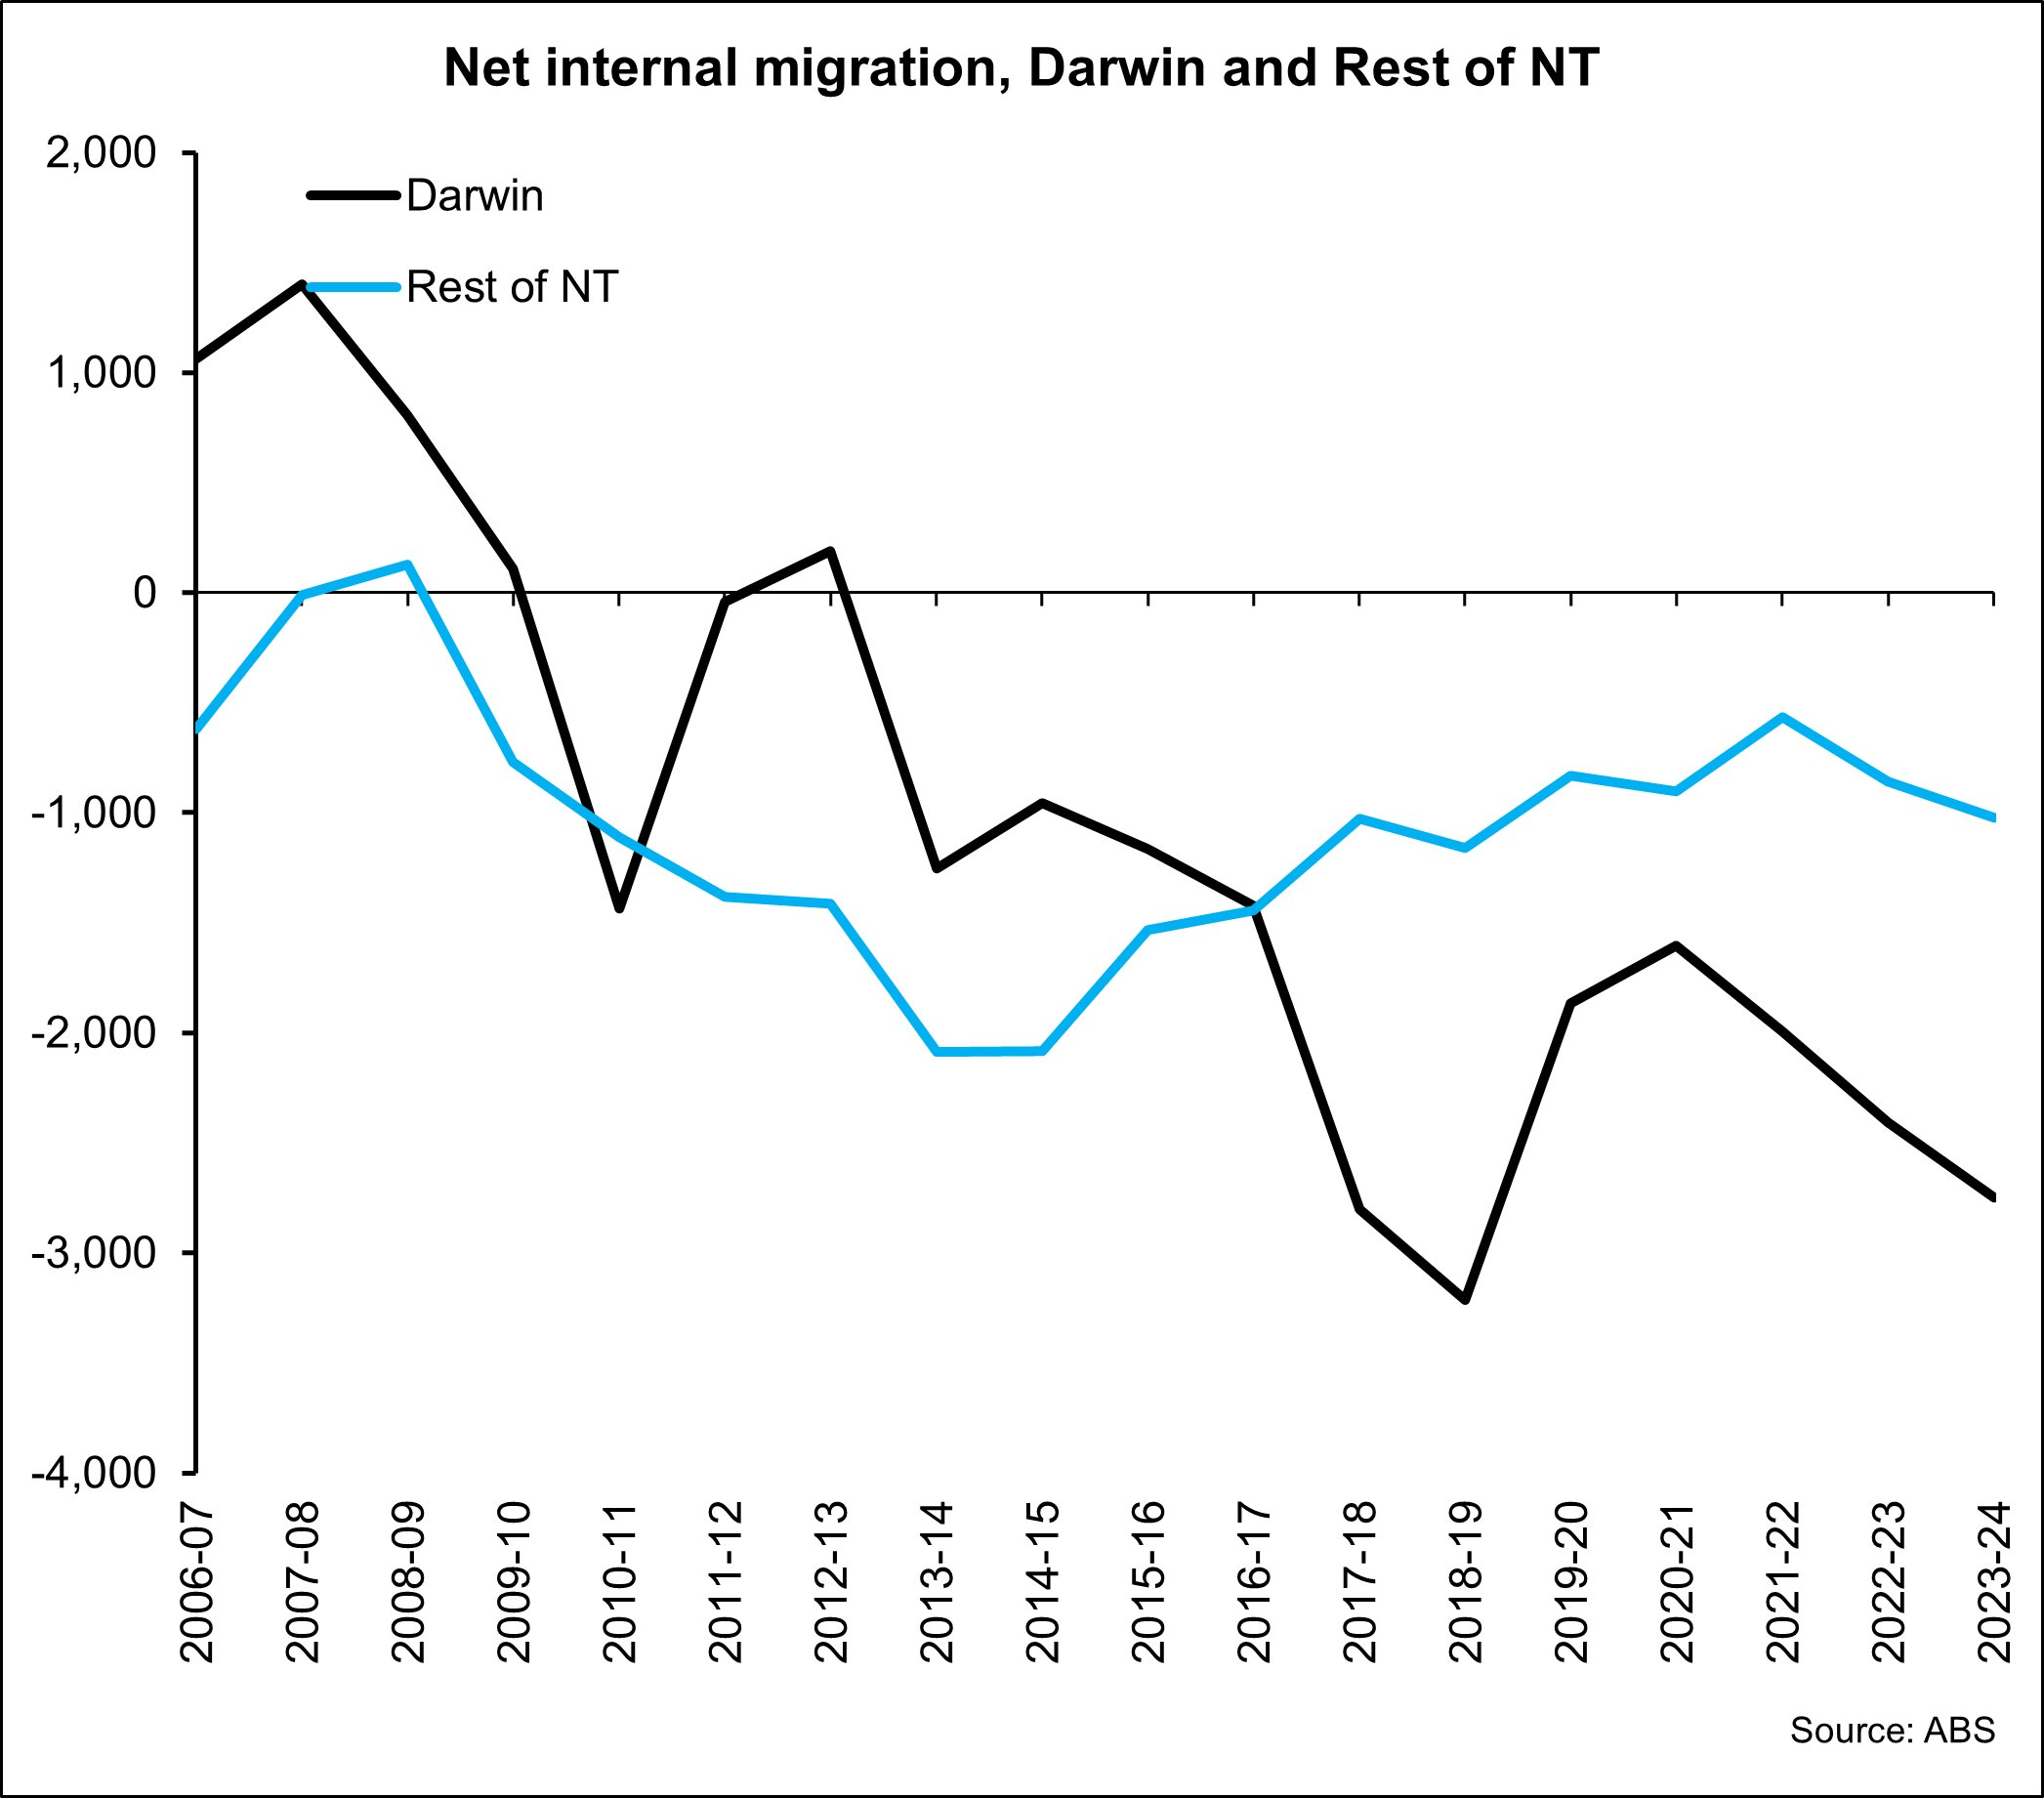
For the best part of a decade now net internal migration to NT has been negative. The NT as a whole has a highly transient workforce and when opportunities reduce for employment you tend to find people are much more inclined to leave and that is certainly what’s happened over the past decade.
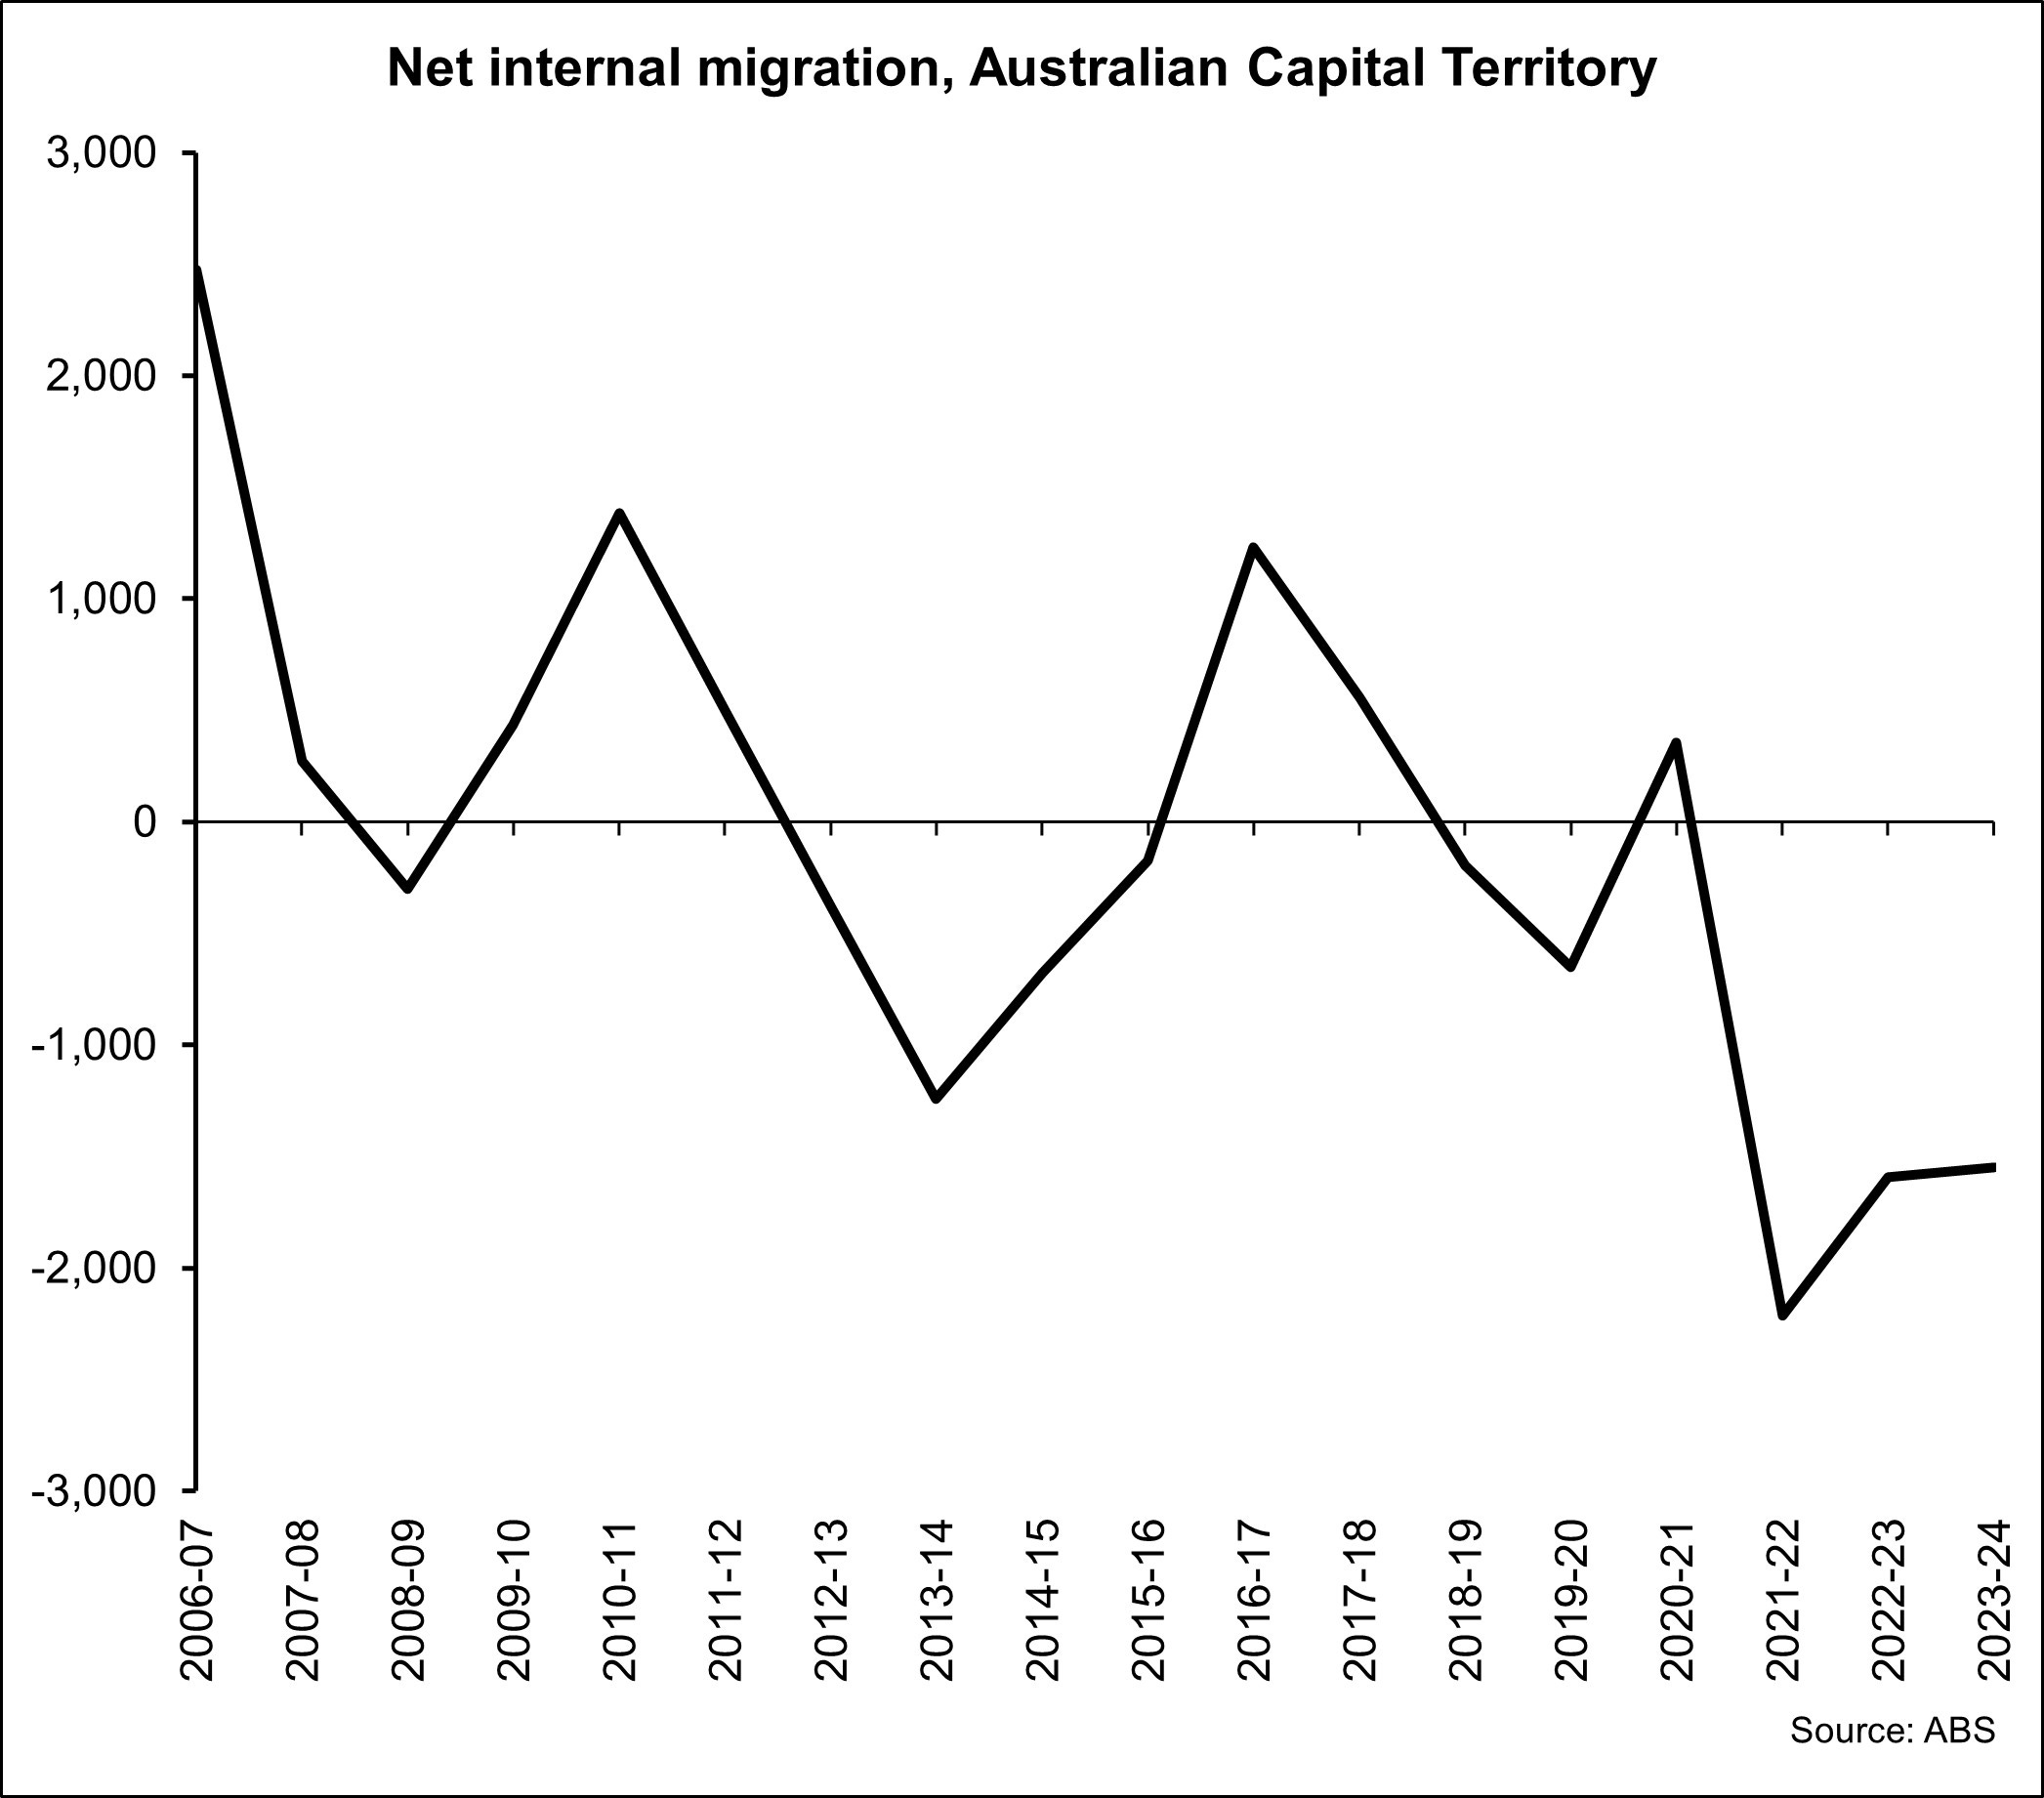
Finally, ACT has been quite volatile with regard to its net internal migration over time but in recent years it has been losing more people than it has gained. Again, the ACT has a more transient population so that is likely a driver. So too with the high cost of housing in Canberra it may be the case that people that live in the ACT are actually shifting to cheaper nearby locations in NSW.
So, what does this data tell us. Firstly, the main driver of national population growth is net overseas migration which has been elevated over recent years. Overseas migrants have a strong preference to settle in the larger cities and regions which makes sense because this is where most of the universities and job opportunities reside. While the large volume of overseas migration is seeing strong population increases in Sydney and Melbourne, these cities continue to lose their current residents to other parts of the country.
Regional areas are seeing slower but more stable population growth than capital cities. The key driver of population growth in regional areas is net overseas migration, albeit it is much lower than it is in capital cities and people moving away from capital cities to these locations.
From a housing market perspective this data highlights the importance of building enough housing and enough of the right type of housing in the right location to cater to the heightened level of population growth. In capital cities this means a mix of higher density and lower density options along with student housing on or close to university campuses. In regional areas it means ensuring that enough new housing delivered to keep prices affordable and attractive for people intending to leave the capital cities and they need to ensure there are ample job opportunities and amenities to continue to attract would-be movers, many of whom come from capital cities.
Over the coming weeks I intend to take a closer look at the more granular data disseminating where people are shifting to within the capital cities and regional markets both from a net overseas migration and net internal migration perspective.